The general consensus among many professionals in the financial world is that index funds are superior to individual stock picking. I have a contrarian opinion about the whole matter, one that is hotly contested and often adamantly opposed.
However, it’s an approach that works for me. And it’s one that I’ve put a lot of thought and time into defending.

So today I’ll answer a reader’s question about this classic indexing vs. individual stocks debate. I’ll also answer a second email I received regarding foreign stocks and the Value Trap Indicator spreadsheet. Feel free to email me your questions at [email protected].
Love the money tree podcasts Andrew, and congratulations on beating the S&P 500 with your value stock picks. As you know, value stocks (as a group) have historically done better than the S&P. Why wouldn’t someone just invest in value indexes instead of doing all your research? Thanks, Dan
For those who aren’t inclined to do the research, an ETF index would be better suited. Many of them have done very well in the long term and they are great investment tools.
But there is a potential advantage to picking individual stocks over an index. The biggest advantage I can see is through the power of compounding interest. Picking the right individual stock will give you much more through dividend reinvestment and growth.
When you pick the right dividend growing stock, you’ll see returns compound very quickly. Let’s say a good dividend stock grows its dividend around 10% a year, at an initial 3% yield. Obviously you aren’t getting rich from that 3% dividend the first year, second year or even third year.
However, as the dividend keeps increasing, the yield on your initial investment continues to rise. The first year pays you a 3% yield. The second year pays you a 10% higher yield, making the new yield about 3.3%. This continues throughout the years until the yield can total 20% or more.
If you reinvest the dividends automatically, the money starts to grow exponentially. As these dividends are reinvested, more shares are collected which lead to higher dividend payments. Hopefully you can see how this leads to higher and higher dividends. Combine that with the increasing yield each year and the capital accumulates substantially.
Take the following example. You can make the same calculation with this reinvestment calculator. Take a stock with an initial investment of $10,000 with a 3% dividend, growing 7% a year and growing its dividend by 10% annually.
After 10 years of automatic dividend reinvestment, the annualized return rises to 10.75% on a stock that is only appreciating in price by 7% a year. This would turn $10,000 into $27,757. After 20 years, the annualized return rises to 11.34% and total capital to $85,770.
After 30 years, the annualized return becomes 12.06% and total capital of $304,741. 40 years of compounding rises the annualized return to 12.94% and a staggering $1,297,792 of total capital.
You can see the total value balloons as years of compounding continue to have its effect. The reason that the total value becomes so high is because the dividend payment is increased each year. So that initial 3% yield later becomes 5%, 10%, or even 20% or higher.
In fact, using this dividend calculator you see the final yield on our example would be 403.16%. That means by year 40, enough shares have been accumulated to make the annual dividend payment equal to $40,315, 4x more than the $10,000 that was initially invested!!
This is the power of individual stocks. Of course, you have to be able to pick an occasional winner who can sustain dividend increases such as this. But the upside is so great, and so much capital can be made on such a small initial investment.
Compare this to the average popular ETF like those that hold the S&P 500. Because there are so many stocks in this basket, many of them either don’t pay a dividend, stop paying a dividend, or fail to increase their dividend.
You can see this visualized in this chart. The amount of dividend increase varies substantially and even falls during harder times. This has the effect of slowing down the possible compounding from dividend reinvestment. Consequently, the yield on cost doesn’t rise as high for ETFs holding a basket of stocks.
Just how pronounced can this difference be? Taking a very favorable time period, starting from 06/2016 all the way back to 06/1976, over 40 years the annualized return of the S&P 500 including reinvested dividends would be 10.96% (calculated here).
Consider that the difference between 10.96% annualized and the 12.94% annualized would be from $640,704.72 to $1,299,904.17 using a simple compounding interest calculator.
I don’t know about you, but a chance to outperform by 2% leading to doubling my final capital amount is one I’m willing to take. Consider also that the returns of popular value investors have routinely been over 13% annually.
Of course, your results may vary… but the opportunity is there. That’s why I choose individual stocks over ETFs for my money. To me, the potential gain difference is worth the work I put in to analyze companies.
Hey Andrew,
I listened to your webinar the other night and invested in your WEB2 promo. I started identifying stocks that I wanted to use the VTI test. I did Delta and LG Display (LPL). DAL was easier but LG was very time consuming and I ended up getting some data off E-Trade. LPL didn’t have a 10k. Do you use the 20F for foreign companies? Maybe you could do another webinar on that as I found it extremely difficult.
Can you briefly look at my first 2 VTI spreadsheets to see if I did them correctly? I don’t want to use the VTI until I know I can trust that I’m actually inputting the data correctly. If you can spot check it to see what I am doing right/wrong, I’d really appreciate it.
Thanks,
Matt
I don’t invest in foreign stocks for 2 reasons. They have additional tax implications, being double taxed both abroad and here. They also aren’t regulated by the SEC. Some of them might file with the SEC but they aren’t required to by law like U.S. stocks are.
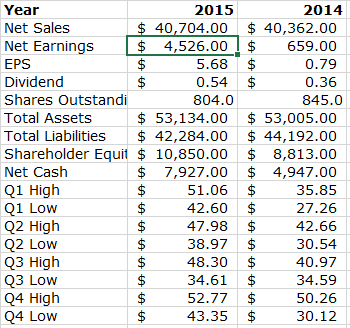
Here’s my take on your DAL spreadsheet. Net cash is “cash and cash equivalents at end of period”, not “net cash provided by operating activities”. So net cash should be $1,972, $2,088, and $2,844 for 2015, 2014, 2013, etc.
Not sure what happened for 2014 Total Assets but that should be $54,005. Total Assets for 2013, 2012, and 2011 should be $52,252, $44,550, and $43,499. You’ll find Total Assets in the “Consolidated Balance Sheet” under “Total Assets” and also under “Total liabilities and stockholders’ deficit”.
For EPS, use “Diluted Earnings Per Share” over “Basic Earnings per Share”. Diluted EPS includes outstanding stock options and RSUs that employees of the company have ownership of and can liquidate. So EPS should be $5.63, $0.78, and $12.29.
The dividend row is also wrong. You can find dividends in “Consolidated Statements of Operations”. Under “Cash Dividends Declared Per Share”, the dividend payment is $0.45, $0.30, and $0.12 for 2015, 2014 and 2013.
In the case that dividends aren’t in the consolidated portion, you can also find them in “Item 5. Market for Registrant’s Common Equity, Related Stockholder Matters and Issuer Purchases of Equity Securities”.
Everything else looks good to me and you seem to have a good grasp of it.
