A company’s Cost of Goods Sold, or “COGS” for short, are the costs directly associated with the goods that the company sells. COGS are variable depending on how many sales take place which means that if a sale does not take place, then these costs are not incurred. For companies which sell customers a service, the figure is commonly referred to as cost of sales or cost of services.
For this article, we will use the COGS acronym as we discuss where COGS can be seen on the income statement (and even the balance sheet!), what type of expenses make up COGS, and the figure’s usefulness in analyzing a company.
We will finish with an example analyzing wide-moat companies Coke and Pepsi compared to a couple more narrow-moat companies in the competitive chemicals industry.
COGS on the Income Statement
COGS sits right near the top of the income statement under revenue as can be seen in Coca-Cola’s 2018 income statement seen below.
The net amount of revenue minus COGS forms the company’s gross margin so the two figures are closely intertwined. Whenever someone is talking about the COGS or gross margin of a company, the other missing piece is always the remainder after subtracting 100%.
For Coke in 2018, the $11,770M of COGS represents 36.9% of sales which implies that Coke’s gross margin for 2018 was 63.1% (100% – 36.9%). Knowing either COGS or gross margin, gives you the information to know the other.
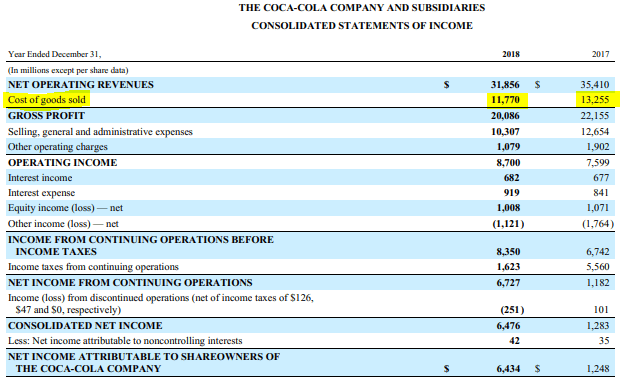
Sourced from Coca-Cola’s 2018 Annual Report
Future COGS Capitalized on the Balance Sheet
The relationship between COGS and inventory is a fixed one that can even be expressed in a formula as seen below. The matching principle of accounting means that expenses must be recorded in the same period that the affiliated revenue is earned/the expense’s benefit is used up.
For COGS, this means that if the associated good is not sold in the same period that the good was procured, the cost is capitalized on the balance sheet as inventory. When the product is subsequently sold, the inventory is reduced and the COGS expense flows through the income statement.
COGS = Beginning Inventory + Purchases – Ending Inventory
COGS Inputs Differ by Industry
While COGS consists of different items depending on the industry, the fundamental determination is the same and that is that COGS consists of the direct costs associated with the procurement, production, or performance of goods and services. The key word here is “direct” which will get drilled into your head as we discuss a few of the common industries.
For retailers, COGS primarily comprises the cost to purchase the merchandise for resale but also includes less significant costs such as freight, duties, and other non-recoverable input taxes. Discounts received on the purchase of merchandise such as volume rebates or discounts for early payment need to be deducted from COGS.
For manufacturers, COGS includes not only the raw materials for production including major pre-built parts purchased from suppliers, but also includes the little screws that put these parts together. As always, the associated freight, taxes, and discounts need to be taken into account on these direct items. Crucially with manufacturers, COGS now also includes other items directly involved in the production of the final product such as direct labor for production workers, supplies used up in the production of goods (such as grease for machines and masks for workers), the depreciation of production equipment, as well as other overhead costs directly attributable to the production process (such as electricity for the factory and factory supervisor salaries).
For service companies, COGS (now referred to as cost of sales/services) mainly consists of the direct labor associated with performing the service for the customer as well as any materials used up in performing the service. If the employee has to drive to the residence of the customer, than the gas and depreciation of the vehicle should also be included. If the company’s business is software as a service (SaaS), then items such as server/hosting costs, customer support, and amortization of previously capitalized research and development costs (similar to depreciation for the manufacturer) should be part of COGS.
Side Note: It is important to remember that selling costs such as sales associate’s salaries are generally not included as part of COGS but are instead included under operating expenses below the gross margin line. This is because these costs do not pass the test of being variable to sales. For example, if a store is open all day but no one buys anything, the sales associate’s salaries still need to be paid even though no revenue was generated.
What Information Can Be Learned from COGS?
Analyzing COGS can show operational efficiencies in production and pricing power over suppliers when compared to the amount of volume sold.
If a company is able to produce/procure the same volume and quality of goods for less cost than in prior years or for less than competitors, this is an indication that the company is gaining or already has production efficiencies or bargaining power over suppliers.
Taking into account revenue and looking at the net gross margin figure, we can also analyze the bargaining power customers have over the business. For example, if COGS is rising and revenue is flat, this is a signal that the company is not able to pass on rising costs to the customer and this is a signal of weak pricing power by the company due to large bargaining power of customers and low brand value.
In general, a company with low gross margins is indicative of a business operating in a commoditized industry.
Example with Wide-moat Coke and Pepsi
Both Coke and Pepsi have great brands and bargaining power as exemplified through their high gross margins averaging 61.6% and 54.7%, respectively, over the past 5 years and low standard deviation of gross margins/COGS of 1.1% and 0.5%.
As expected, Coke seems to command the stronger brands and pricing power of the two with the higher gross margins. Both companies have a low standard deviation of gross margin/COGS which signifies that they are able to pass on to customers price increases in their production processes because their brand power is so strong and the threat of substitutes so low (90% of soft drink brands I can think of are either Coke or Pepsi products!).
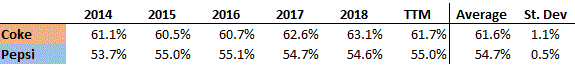
Source data from Morningstar
Example with the Competitive Chemical Industry
For an example of what lower and more volatile COGS looks like, let’s take a look at the competitive chemicals industry with LyondellBasell and BASF. As exemplified through their high gross margins averaging 17.9% and 28.8%, respectively, over the past 5 years the industry is competitive with dozens of major competitors producing the same of similar products. The fact that BASF has higher gross margins may be indicative of the company selling more specialized chemical products.
The much higher standard deviation of gross margins/COGS for both companies is evidence that they have less bargaining power both in their relationship with customers and suppliers.
The conclusion would be that the chemicals industry is more commoditized in general than that of the beverage industry.
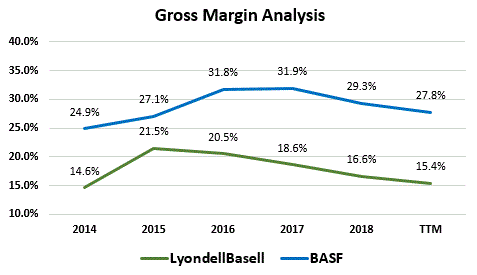
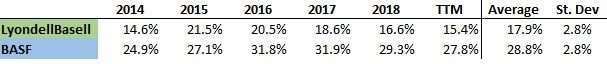
Source data from Morningstar
As can be seen, COGS can be a powerful tool in getting a sense of industry dynamics and a company’s position in it. To witness the performance of a company with low COGS and great gross margins deteriorate is an indicator that the company is losing its competitive advantage and economic moat.
That being said, investors always need to keep in mind that margins are not the be-all and end-all as returns on equity come together through the DuPont Equation in which margins are only 1/3 of the equation.
