Updated 8/7/2023
The income statement is the first of the big three financial documents that all public companies must file. But what do we know about the income statement structure and how the statement flows from the top to the bottom? Have you ever heard the terms top-line or bottom-line? What do those terms mean?
Today, we will uncover the income statement structure and help you understand the components that make up the income statement.
In our continuing series on accounting, we will next dive into the three major financial documents that publicly traded companies must file. The importance of understanding these statements can be the difference between sweet gains and mind-numbing losses.
Accounting is a language; we must start with the basics, like every new language we learn. And the basics include understanding the structure of the statements and the terminology involved. Think of it like learning new vocabulary; you start with the basics and grow from there.
Terms such as revenue, costs, and profits might seem simple, but do we understand where they originate from and their impact on our understanding of any business?
My goal with this post is to help peel back the onion, reveal the terms, and help you better understand the income statement structure.
Don’t worry; you don’t need a degree in accounting or have to become a CPA to understand these documents; just a little reading and putting the pieces together to understand the whole picture. I know you can do it because I did it, and you can too.
In this post, we will learn more about:
- What is an Income Statement?
- Income Statement Structure
- Breakdown of Each Component of the Income Statement
Ok, let’s dive in and learn more about the income statement structure and how the income statement works.
What is an Income Statement?
As I mentioned above, the income statement is one of the three main financial statements that publicly traded companies use to report the company’s financial performance over a specified time—the other statements are the balance sheet and cash flow statement, which we will cover soon.

The income statement, also known as the profit and loss statement or statement of revenue and expense, focuses primarily on the income and expenses during a specific period, such as quarterly or annually.
The goal of the income statement is to report a company’s net income or earnings for the period reported; remember that all publicly traded companies are required to file an income statement, but not all private companies file them. Although, as we have mentioned in past articles on accounting, these standards have been adopted by most companies as they allow insiders and outsiders to assess the company’s financial performance.
The basic form that each income statement follows is this:
Net Income = ( Total Revenue + Gains ) – ( Total Expenses + Losses )
Total revenue is the sum of all the company’s revenues, such as operating and non-operating revenue. And total expenses are the sum of all expenses required to generate those revenues, such as primary and secondary operations.
An important note: revenues are not receipts!
Revenues are earned and reported on the income statement; receipts do not report, as are cash paid out or in don’t get recorded.
The importance of the income statement lies in the valuable insights it provides into the company’s performance. Items such as the efficiency of management, the profitability of the company, and its performance compared to its peers are possible.
The income statement focuses on four main items:
- Revenue
- Expenses
- Gains
- Losses
Starting at the top, it begins with the details of sales, then progresses to compute the net income or earnings, and finally, the earnings per share (EPS).
Essentially, the income statement tells us how a company realizes profit or loss from its revenue.
On Wall Street, the income statement is a huge focus, especially the net income section, in the form of earnings per share. The focus of growth on the bottom line or net Income is the ultimate goal of most companies and the rat race of Wall Street. That is why Buffett spends most of his time ignoring these siren calls and focuses on the company’s operations.
Everyone occasionally hears about earnings fraud, and typically, it begins with alterations to the income statement in the form of changing how the revenue is recognized or other manipulations. Recently the coffee company Luckin found itself in a lot of hot water (no pun intended) because it fraudulently reported revenues that did not occur.
Now that we have a basic understanding of what the income statement is and how it functions let’s look at the basic structure of the income statement.
Income Statement Structure
Below is a basic outline of the income statement structure. In the next section, we will break down each income statement component.

Revenue
- Costs of Goods Sold Expense
= Gross Profit (or Loss)
- Operating Expenses (R&D, Selling & Admin, Depreciation, etc.)
= Operating Income
Other Income / Expenses
+ Investment Income
- Interest Expense
- Taxes
+/- Non-Recurring Events (Extraordinary items)
= Profit or Net Income / Loss
The above is a basic outline of an income statement, and as you work through reading financial statements, you will encounter slight differences depending on the company and industry. For example, if you look at Microsoft’s income statement, you will see a line item for R&D or research and development. Likewise, if you look at an income statement for Walmart, you will notice that the line item doesn’t exist.
Why is that? Because Microsoft is in the tech sector, its bread and butter are creating new and more improved products, where Walmart is decidedly not a tech company, and those items are necessary for its business, thus eliminating that line item.
There are two types of income statements, the single-step income statement, and the one that all listed companies follow, which is the multiple-step income statement.
The single-step income statement is based on the calculations that sum up the revenues and gains and then subtracts the losses and gains to arrive at the net income or profit.
The multi-step income statement follows the same basic structure but includes far more detail. It separates the operating revenues, operating expenses, and gains from non-operating gains and expenses and offers far more detail than the single-step income statement.
The multi-step income statement measures the profitability of the company in four stages of the business’ operations:
- Gross
- Operating
- Pre-tax
- After-tax
The bonus of this segmentation is that it allows us to see the company’s profitability as they move through each income statement level. For example, if you see a company with a high gross profit level but lower operating profit, that would indicate higher expenses. In contrast, higher pre-tax profit and lower after-tax profit indicate losses due to high taxes or other unusual one-time expenses.
An example of the above might be a company showing a profit before a one-time large tax payment, which causes the company to show a net income loss. Or they might have a non-recurring charge of expenses that causes the company to show a net income loss; on the flip side are one-time gains that help the company show a gain for the period.
The above examples are great examples of the importance of the income statement structure, understanding how the line items flow from one to the other, and how to read the income statement and the different levels of the company’s profitability.
As we work through the descriptions of the components of each section of the income statement, remember that terms such as “top-line” or “bottom-line” refer to line items in the income statement. The top line references the revenue line item, and many growth investors focus on revenue growth, whereas the bottom line references the net Income or earnings of the company. The bottom line is a favorite of Wall Street, and many investors focus on that line item instead of other ingredients to constitute the company’s net Income.
Let’s move on to the components of the income statement.
Break Down of Each Component of the Income Statement
Now that we understand what an income statement is and what the income statement structure constitutes. Let’s dive in and explain each line item so we understand those terms, remember, we are learning a new language, and these are our vocabulary terms to learn.
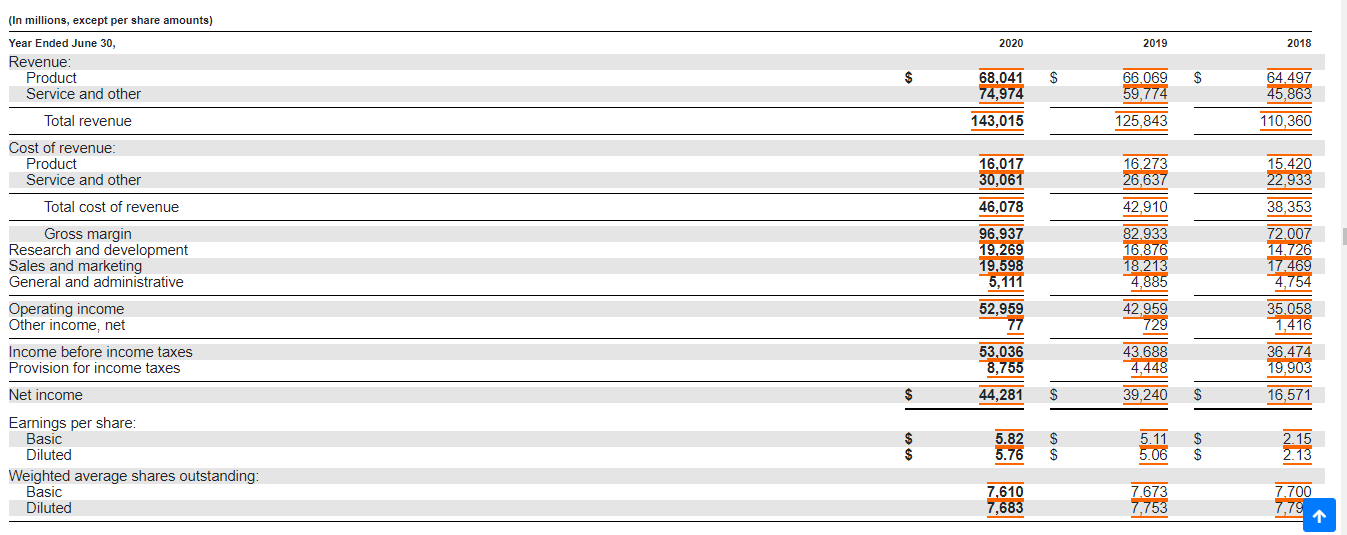
For example, we will walk through the Microsoft (MSFT) latest 10-k from year-end June 30, 2020.
Revenues/Sales
Revenues are the company’s revenue from the sales or services the company offers to customers, always displayed at the top of the income statement. Also referred to as the top-line and is a gross number or total of sales achieved for the period.
Many companies, such as Berkshire Hathaway, have multiple businesses that contribute multiple revenue streams to the total revenue line; in fact, some companies list those revenues from each segment on the income statement to help clarify the company results.
Others will list those separate revenues in the financial notes to the financial statements; no rule requires a company to list them separately on the income statement.
This is a small sign of having the shareholder’s interest first instead of looking elsewhere for that information.
As we can see from Microsoft’s income statement, they break up their revenues into segments and total those for $143,015.
Costs of Goods Sold or Cost of Revenue
Costs of goods sold are the line item that adds up the direct costs associated with selling the products and services that Microsoft produces to generate revenue.
Other terms associated with the same idea are the cost of sales if the company is a service business.
Examples of the direct costs associated with the revenues are labor, materials, parts, and depreciation (or the allocation of that item here).
Microsoft had a total cost of revenue for the year of $46,078.
Gross Profit
Gross profit or gross margin is the amount of money Microsoft has made compared to its revenues minus the costs associated with creating those revenues.
We typically express Gross profit as a percentage, and you calculate it by dividing the gross profit by the company’s total revenues.
Microsoft has gross profits of $96,937 and a net margin of 67.8 percent. The higher, the better, as it lends to profit farther down the line.
Research & Development (R&D)
R&D expenses are often associated with developing a company’s goods or services. Microsoft, for example, incurs its research and development expenses in discovering and developing new products or services the company offers.
Companies in the sectors such as industrial, tech, health care, and pharmaceutical generally have the highest R&D expenses. Many in the tech world, such as Intel, invest most of their profits into R&D.
Not all companies will list any R&D expenses, so this is a line item you might not see in every income statement.
Microsoft reported R&D expenses of $19,269
Marketing, Advertising, and Promotional Expenses
Almost all companies have expenses associated with marketing and advertising the company’s products and services.
Many companies will lump these expenses into another line item, such as selling, general, and administration, which we will discuss next.
Microsoft split these items into two line items, and this example best exemplifies how each company will look at these expenses and how they choose to list them on its income statement.
Try not to get caught up in the jargon and realize that these are expenses that most companies incur and lump them together if that helps you clarify them.
Selling, general, and Administrative Expenses (SG&A)
The above line item helps break out other indirect expenses related to running the business. Components of the line item include salaries, wages, rent, office expenses, insurance, travel expenses, and sometimes depreciation and amortization. Although, some companies will break out depreciation and amortization separately, or they might list it in the notes to the financials section.
As we look at Microsoft’s income statement, we can see that the company lists sales and marketing as a line item, then general and administrative as another line item. Again realize that both items add up to the same idea; it contains items that are not direct costs to producing the items or services that Microsoft sells; rather, they are supportive costs associated with those sales but are expenses or costs the company incurs.
Microsoft reported combined expenses in the two-line sales and marketing items of $19,958 and general and administrative expenses of $5,111.
Depreciation and Amortization
Most analysts consider depreciation and amortization as non-cash expenses, although Warren Buffett strongly disagrees with that statement. But that is a conversation for another day.
Consider depreciation and amortization as an accounting term allowing a company to spread out capital assets such as property, plant, and equipment or PP&E.
Microsoft doesn’t include depreciation and amortization as a separate line item on its income statement. Looking through the notes to the financials helps you discover the expense that Microsoft accounts for on its financial documents.
Microsoft reports a depreciation and amortization expense of $10.7 billion in 2020. Buffett argues that this is a real expense, and he includes the item in his owners’ earnings calculations, but for our purposes here, we will leave it as is for now.
Operating Income or EBIT
We arrive at the next stop point on the profitability scale. Operating Income is the profit a company realizes from the operations of the company, such as sales, costs associated with those sales, and then voila!
The operating income profit is before subtracting any non-operating revenues, non-operating expenses, interest, and taxes from the revenues.
EBIT is a term often used in finance and is synonymous with operating Income.
As with gross profit, we can determine the operating income profitability by looking at the number of the revenue of the company. We express it as a percentage and calculate the ratio by dividing the operating Income by the company’s revenue.
For example, Microsoft reported an operating income of $52,959, and then we divided that by the company’s total revenue to arrive at an operating income margin of 37 percent.
Interest
Interest expense and interest income often list as separate line items. Interest expense is the cost of borrowing money, or it is the money a company pays for the money it borrows. Typically on the income statement, the interest expense is the cost of borrowing from banks, bond investors, or other sources.
Interest income is the money a company will earn on its investments, such as a bond portfolio; this line item is far more common in financial sectors such as banks, insurance companies, or investment banks. It refers to the difference between the interest it earns on its investments and the associated costs. Banks refer to this line item as net interest income.
Microsoft doesn’t report any interest expense or income on its income statement.
Other Expenses
Businesses often have expenses unique to their sector, and they might list those items separately from the expenses listed under the operating sections of the income statement—items such as stock-based compensation, impairment charges, foreign exchange impacts, and many more.
Microsoft doesn’t list any other expenses on its income statement.
Income Before Income Taxes
Many companies will list this line item less the interest expense as the number before subtracting taxes. It is also known as EBT or Earnings Before Taxes.
Microsoft reports Income Before Income Taxes of $53,036 for 2020.
Income Taxes
Everybody’s favorite taxes! The income tax line item refers to the income tax the company must pay for the period; in many cases, it will contain current taxes plus future tax payments.
Some companies will list the tax rate the company is paying, but you can calculate it by dividing the income tax line by the Income before income taxes, or EBT.
In Microsoft’s case, the company paid $8,755 in income taxes for a tax rate of 16.5 percent.
Net Income
Finally! We have arrived at the bottom line, or the company’s earnings, or the company’s total profit. We calculate net Income by subtracting the pre-tax Income from the income taxes. The net income flows into the retained earnings on the balance sheet minus any dividends paid. It also flows into the net Income of the cash flow statement, but more about those statements in upcoming posts.
Microsoft reported a net income or earnings of $44,281 for 2020. We can also calculate a net income margin, which tells us the company’s profitability. To find this margin, we divided the net Income by the total revenue, and in Microsoft’s case, the net income margin for 2020 was 30.9 percent.
Earnings per Share
The final section of the income statement is the main focus of Wall Street, the calculations for earnings per share. Here you will find the calculations the company calculates for you; it includes items such as earnings per share, diluted earnings per share, and weighted average shares outstanding.
Diluted shares outstanding take into account items such as options, warrants, or preferred shares, and I like to use those because it is more conservative and a worst-case scenario.
To calculate earnings per share, we divide the net income by the diluted shares outstanding and arrive at our number. Microsoft lists the shares outstanding for our information, but not all companies list them on the income statement, so if you encounter this, you can find the shares outstanding on the first page of the 10-k or 10-q at the bottom of the page.
Final Thoughts
Studying the income statement helps us get a great idea of the efficiency of the operations of any company we are analyzing. There is a ton of information contained in the income statement. And understanding the income statement structure helps you find any problems in the company’s operations.
If a company has the cost of goods sold that are running too high, profitability farther down the income statement will be next to impossible. Every sector will have different standards for profitability at different stages of the income statement.
One of the best ways to work through the income statement is to look at the numbers for one year and calculate any profitability margins, then do the same over a five or ten-year period to see any trends you might find. After that, try looking at other companies in the same sector to see how Microsoft might compare.
Diving deeper into the income statement structure and seeing trends in your business will give you a much better sense of the company’s operations. If the company struggles to create profitability, the reasons for that will become much clearer as you study the income statement.
That will wrap up our discussion today on the income statement structure.
As always, thank you for taking the time to read this post, and I hope you find something of value on your investing journey.
Please don’t hesitate to reach out if I can further assist.
Until next time, take care and be safe out there,
Dave
