Investors looking to chase higher market returns can look to Joel Greenblatt’s book The Little Book That Beats the Market. In the book, Gleenblatt taught about a magic formula.
That formula consisted of two distinct parts: earnings yield and return on capital.
The way Greenblatt defined earnings yield and return on capital (which are somewhat subjective measures) was as follows:
Earnings yield = EBIT / Enterprise Value
Return on Capital = EBIT / (net fixed assets + working capital)
Introduction to Joel Greenblatt and “The Magic Formula”
Joel Greenblatt ran the hedge fund Gotham Capital from 1985 – 1995 for an annualized return of 50%. He wrote about this track record in his book, You Can Be a Stock Market Genius.
The basic premise of the magic formula is to combine a highly profitable and efficient company (and one that can quickly and easily grow) with a low valuation metric based on earnings. Picking only the best stocks that scored well in both areas, Greenblatt was able to produce outstanding returns for his investors. He replicated similar results in numerous backtests.
More specifically, Greenblatt combined a high earnings yield with a high return on capital to pick only the stocks with seemingly the best chances for future success.
In addition to looking for stocks with a high earnings yield and return on capital, Greenblatt included the following criteria:
- Market capitalization > $50 million
- Avoid stocks from the utility and finance industry
- Invest only in U.S. stocks
- Buy 2-3 of the highest scoring stocks each month, for 12 months
- Sell all positions after a one year holding period (selling losers before 365 days to utilize short term tax harvesting, selling winners after 365 days to get long term capital gains instead of short term)
Let’s look at the financials for a company in the list of high ranking magic formula stocks from Greenblatt’s website. In this case, we’ll start with the highest ranking stocks with a minimum market capitalization of $10B.
The company will be Cisco ($CSCO).
Here are some key financials we can examine from the company’s latest 10-K filing.
Calculating Earnings Yield for Cisco
- Net Sales = $51,557
- Gross Profit = $32,248
- Operating Profit= $13,969
Note: All numbers in millions
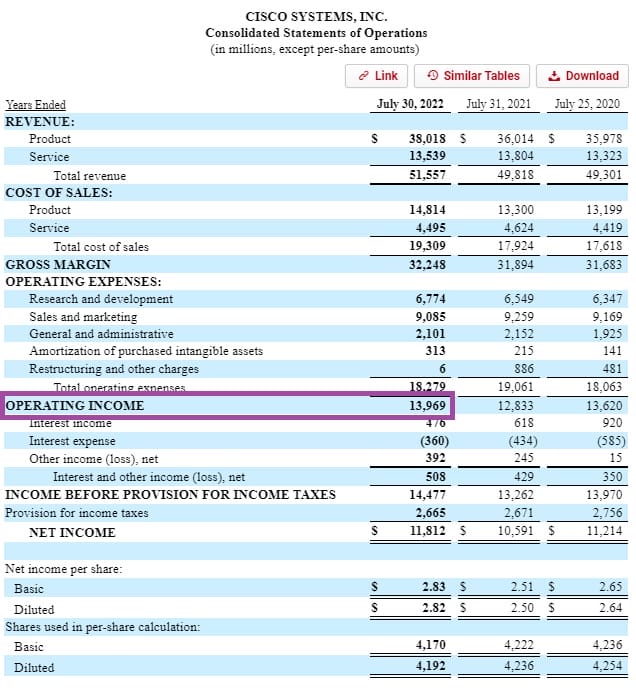
We want EBIT, also known as Operating Income.
Then we can use this value to calculate both Earnings Yield and Return on Capital.
- Operating Income = $13,969 million
To finish our calculation for Earnings Yield, we must calculate the Enterprise value, defined as…
Enterprise value = Market capitalization + Debt (Long and short term) – Cash and Cash Equivalents
Enterprise value tries to more accurately capture how the price at which the market is valuing the stock by also considering how the company is financed (or capitalized).
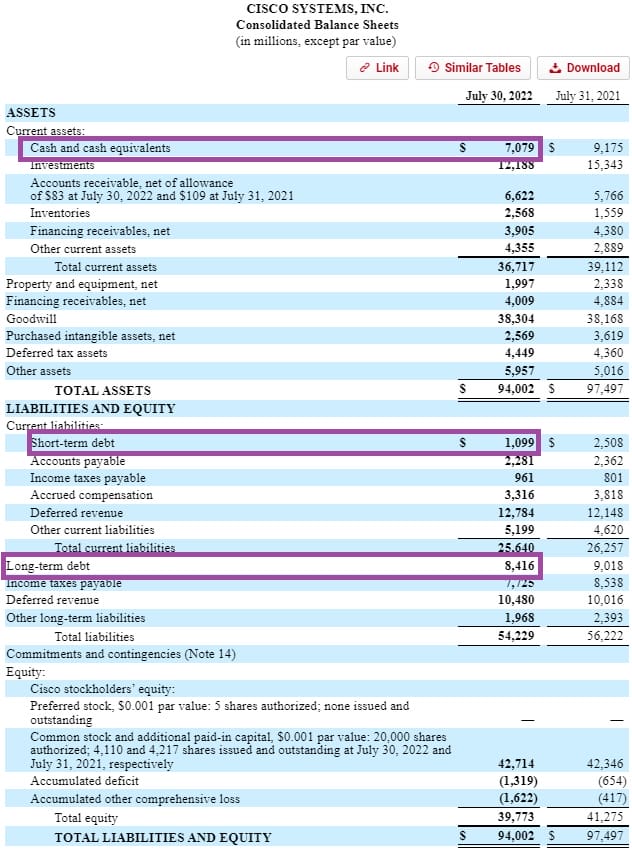
Here are some key metrics, from Cisco’s Balance Sheet:
- Short-term debt = $1,099 million
- Long-term debt = $8,416 million
- Total debt = $9,515 million
- Cash and cash equivalents = $7,079 million
The last part is Market Capitalization, which we can quickly lookup using a website like Google Finance.
- Market Capitalization = $175.55 billion
The Enterprise value now becomes:
Enterprise value = 175,550 + 9,515 – 7,709
Enterprise value = $177,356 million
Taking the EBIT value above, we get an earnings yield of the following:
Earnings yield
= 13,969 / 177,356
= 0.0787
= or 7.87%
One other way to calculate the earnings yield (one that Joel Greenblatt doesn’t advocate) would be to take the inverse of the Price to Earnings ratio (or E/P). An Earnings Yield from that definition at 7.87% would be the same as a stock with a P/E of 1/0.0787 = 12.7.
For those who aren’t familiar with whether 7.87% is a good figure for earnings yield or not, this gives you the P/E version equivalent of 12.7. Compare this to Cisco’s current P/E of 15.18, and you can see that it seems like Cisco’s true earnings power could be undervalued by the market.
Calculating Return on Capital for Cisco
Now it’s time to do the Return on Capital formula. Since we already have the EBIT figure from before, we just need to find the net fixed assets and working capital.
Net fixed assets, as defined by Joel Greenblatt, is Total Assets – Total current assets – Total Intangibles & goodwill.
The simple version of Working Capital can be thought of as Current Assets – Current Liabilities.
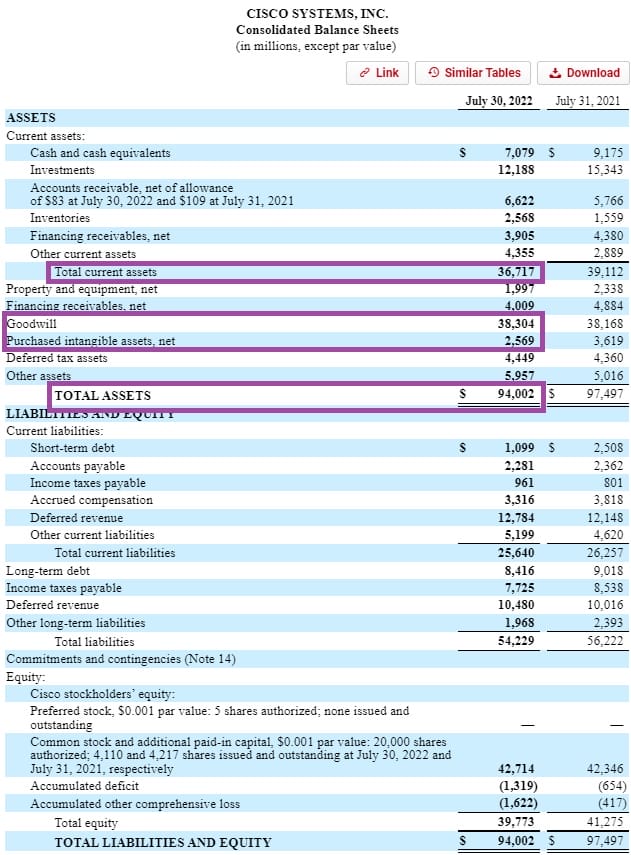
Net fixed assets
- Total Assets: $94,002
- Total current assets: $36,717
- Goodwill: $38,304
- Intangible Assets: $2,569
So, Net Fixed Assets = 94,002 – 36,717 – 38,304 – 2,569
Net Fixed Assets = $16,412 million
Working capital
- Current Assets: $36,717
- Current Liabilities: $25,640
Working Capital = 36,717 – 25,640
Working Capital = $11,077 million
Now it’s time to bring this all back to the Return on Capital formula. Remember that Return on Capital = EBIT / [Net Fixed Assets + Working Capital].
$CSCO Return on Capital = 13,969 / (16,412 + 11,077)
$CSCO Return on Capital = 0.508, or 50.8%
Again, this is a very high value for a magic formula metric.
This stock definitely proves itself to score very high on Greenblatt’s magic formula for this year. It could possibly make for an attractive stock purchase in the short term.
Whether that equates to a good long term holding will depend on how these metrics stack up over multiple years, and if they can continue to improve their EBIT moving forward.
So now that you know how to source these numbers from a company’s 10-K to calculate the two components of the magic formula, you can start to invest like Greenblatt outlined in The Little Book That Beats the Market.
