Publicly Traded Truckload Freight Industry Report: Winter 2023 Results
According to their latest earnings releases, the Recent Winter earnings results of the Top 5 Publicly Traded Truckload Freight companies by YoY Revenues decreased by -6% on average across the board in the October-December quarter. Of the publicly traded Truckload Freight companies who released Winter 2023 earnings results, the following top 5 companies by market […]
The Limitations of The P/E Ratio
If you have learned basic stock analysis, odds are you have learned the price-to-earnings ratio (P/E). A simple equation you can build for any company, the P/E tells you what multiple a stock is trading at compared to its current earnings power. It gives you a quick snapshot of how investors are valuing a business. […]
What’s a Good Debt to Equity Ratio? The Ultimate Guide for Beginners
The debt to equity ratio is a great formula for investors to use as a rule of thumb for determining the riskiness of a stock, based on its balance sheet. That said, not all companies with a high debt to equity ratio are risky companies; not all companies with a low (or zero) debt to […]
How the Piotroski Score Identifies Strong Businesses in the Stock Market
Updated 4/28/2023 One of the biggest challenges when determining whether or not to invest in a company is determining each company’s financial strength. Enter the Piotroski Score, and use the easy rating scale to help you learn a company’s strengths. Value investors love this rating scale as it gives you a good initial insight into […]
What is Degree of Combined Leverage? Definition and Use
Combined leverage is a powerful tool to analyze how a company uses debt, its expected future performance, and how it can amplify increases in sales. This post covers how to calculate this ratio, how it is used, and what it means.
Stock Market Infographic Shows How Eerily Predictive the Shiller P/E Is
This single stock market infographic is perhaps the biggest selling point for Robert Shiller’s method. It clearly outlines that when the Shiller P/E has been high, the market has done poorly– and vice versa. In this post, contributor Andy Shuler introduces Robert Shiller and also presents a great chart showing how the Shiller P/E has […]
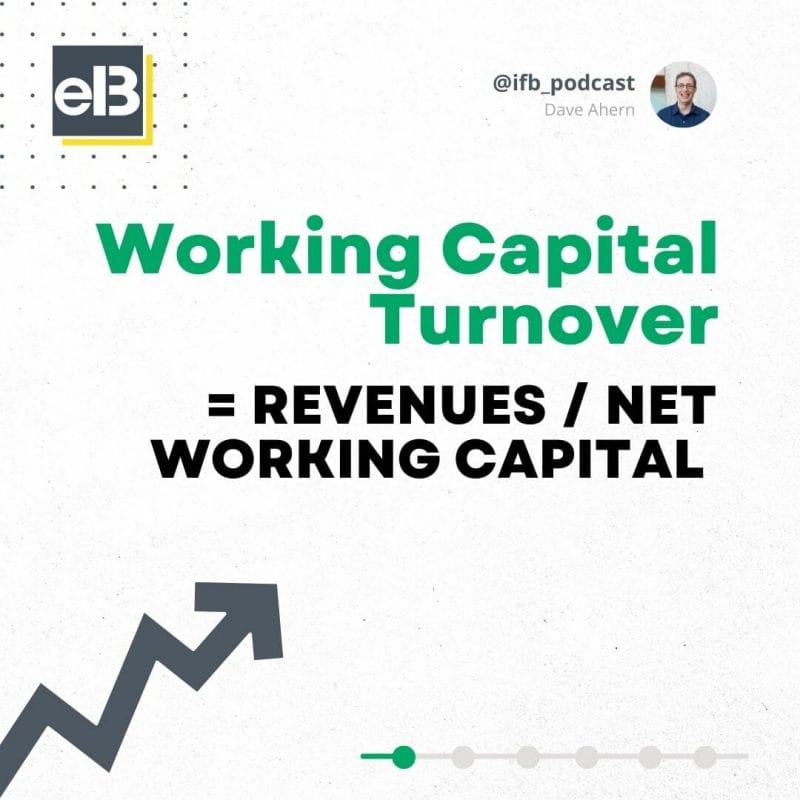
How the Working Capital Turnover Ratio Can Help You Decide on a Worthy Investment

“Over the long term, it’s hard for a stock to earn a much better return than the business which underlies it earns. If the business earns 6% on capital over 40 years and you hold it for that 40 years, you’re not going to make much different than a 6% return—even if you originally bought […]
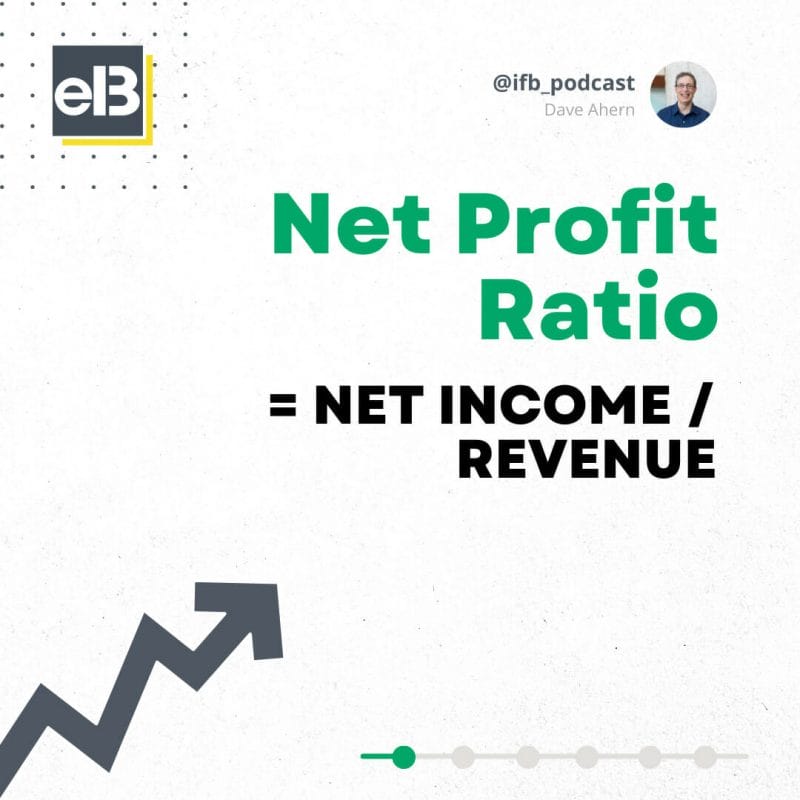
How to Use Net Profit Ratio to Find a Worthy Investment

“If you do good valuation work, the market will eventually agree with you.” –Joel Greenblatt There are many methods for determining a company’s profitability. The net profit ratio is crucial since it measures how much money a business keeps after all costs are covered. Net income equals a company’s earnings, which Wall Street and analysts […]
NEGATIVE PE RATIO – What to Do?
Post updated: 7/14/2023 A negative P/E ratio can be concerning. You can’t really compare a negative P/E ratio with other stocks’ P/E’s. I’ll discuss 3 major reasons a company might have a negative P/E. This blog post will be split into these sections: [Click to Skip Ahead] Be sure to check out the Investor Takeaway […]
Calculate Earnings Yield and Return on Capital (Real-Life Example)
Investors looking to chase higher market returns can look to Joel Greenblatt’s book The Little Book That Beats the Market. In the book, Gleenblatt taught about a magic formula. That formula consisted of two distinct parts: earnings yield and return on capital. The way Greenblatt defined earnings yield and return on capital (which are somewhat […]
