Updated 1/5/2024
Joel Greenblatt owns one of the best investing records on Wall Street, generating over 40 percent compounded returns during ten years. In 2005, Greenblatt published his seminal book, The Little Book that Beats the Market, describing a method investors can use to beat the market, the Magic Formula.
Greenblatt developed and tested the idea of the Magic Formula for years before detailing the idea and illustrating how it might work for investors.
He makes a case for achieving superior returns using the Magic Formula over the long run in his book. The basic idea starts with buying quality companies at a decent price, a la Charlie Munger and Warren Buffett.
As Greenblatt reported in his book, the formula produced CAGR (compounded annual growth rate) returns of 23.8% compared to 9.6% for the S&P 500 from 1988 to 2009.
Greenblatt remains an unabashed fan of Munger and Buffett, and much of his investing style focuses on buying companies for less than their worth. And the formula focuses on using those ideas to identify great companies on sale.
In today’s post, we will learn:
- What is the Magic Formula (Definition)?
- How is the Magic Formula Calculated?
- How Do You Calculate Magic Formula Ratios?
- Does the Magic Formula Work?
- How to Put It To Work
Okay, let’s dive in and learn more about the Magic Formula.
What is the Magic Formula (Definition)?
The Magic Formula is a rule-based investing strategy teaching people a simple, easy-to-understand value investing approach.
The formula relies on companies’ quantitative (numbers) screens and focuses on beating the market – the S&P 500 as a reference.

The formula ranks companies based on their prices and returns on capital, which help sort the companies by cheapness and quality.
“Boil down the analysis to its essence – is it a good business at a good price?” Greenblatt offered one of his Columbia Business School glasses.
Greenblatt developed the Magic Formula as a value investing approach using a framework of organized (numbers) and unemotional perspectives.
The formula suggests purchasing 30 “good” companies, as Greenblatt defines them, cheap stocks with high earnings yield and high returns on capital.
Greenblatt believes the Magic Formula describes a simple version of the strategy used by Munger and Buffett. He originally designed the formula as a tool for average investors and intended for his book to appeal to a younger audience.
So, what kinds of returns have the Magic Formula generated in dollar amounts?
For example, if you invested $10,000 over the period Greenblatt tested, at 24% returns, the money would have turned into $1 million. Compared to the S&P 500, the $10,000 would have turned into $75,000.
Not bad returns, huh?
How is the Magic Formula Calculated?
Greenblatt outlines the two rules for stock investing using the Magic Formula in the book. He compares the stock price to the company’s cost of capital.
Rather than using fundamental analysis, Greenblatt uses those criteria to screen to select the top 20-30 companies meeting the criteria and then buys based on those results.

Greenblatt ranks the companies on the following:
- The company’s earnings equal EBIT or earnings before interest and taxes, also known as operating earnings, a separate line item on the income statement.
- The earnings yield, which he defines as the EBIT divided by the company’s enterprise value.
- The return on capital measures how efficiently the company generates income from its assets.
These encompass some of the main requirements of the screens.
The following outlines a few other requirements for the formula, such as excluding utilities and financial stocks and establishing a minimum market capitalization. Greenblatt mentions companies over $50 million, but you can start at any range.
Here is the entire “formula” laid out to help us understand the requirements and strategy.
How the Magic Formula Works:
- Establish a minimum market capitalization for companies greater than $50 million, $100 million, or $200 million
- Exclude all utilities and financial stocks
- Exclude any foreign companies
- Determine the company’s earnings yield as EBIT divided by enterprise value
- Determine the company’s return on capital, defined as EBIT divided by investor capital, which Greenblatt defines as net fixed assets plus working capital
- Rank all companies in the S&P 500, for example, above the chosen market cap by highest earnings yield and highest return on capital (ranked by percentages)
- Invest in the top 20-30 companies, following the pattern of investing in 2-3 companies per month over 12 months.
- Rebalance the portfolio annually, selling the losers before the year mark, taking advantage of the tax benefits, and winners one week past the annual starting point.
- Rinse and repeat over a 5-10 year period
According to Greenblatt, the Magic Formula strategy has yielded annual returns of 30%. Many independent analysts have found that the Magic Formula strategy has shown good results when backtested compared to the S&P 500.
“For the magic formula to make us money in the long run, the principles behind it must appear sensible and logical but timeless. Otherwise, there is no way we can “hang on” when our short-term results turn against us.
We are buying, on average, above-average companies that we can, on average, buy at below-average prices. The opportunity to invest profits at high rates of return is very valuable because it can contribute to a very high rate of earnings growth!
To earn a high return on capital even for one year, it’s likely that, at least temporarily, there’s something special about that company’s business. Otherwise, competition would already have driven down returns on capital to lower levels. In short, companies that achieve a high return on capital are likely to have a special advantage.
That special advantage keeps competitors from destroying the ability to earn above-average profits. So by eliminating companies that earn ordinary or poor ROC, the magic formula starts with a group of companies with a high ROC.”
Joel Greenblatt
How Do You Calculate Magic Formula Ratios?
Two ratios make up the magic formula. The formula begins with the earnings yield: EBIT/EV, which equals earnings before interest and taxes divided by enterprise value.
Earnings Yield = EBIT / Enterprise Value
A simpler version of the above ratio equals earnings/price. Still, Greenblatt prefers EBIT over earnings because EBIT or operating earnings better reflects operating efficiency and cash flow and allows for better company comparisons. EBIT also ignores the impacts of taxes, which can vary by company.

Greenblatt also used enterprise value over price because it includes the company’s debt.
Therefore, Greenblatt felt that EBIT/EV described a company’s earnings yield better than earnings/price.
The second ratio comprises return on capital, which Greenblatt defined as EBIT divided by invested capital, which he defines as net fixed assets plus working capital.
Return on Capital = EBIT / (Net fixed assets + working capital)
The earnings yield ratio focuses on earnings before interest and taxes compared to enterprise value. The return on capital focuses on the same earnings before interest and taxes compared to tangible assets.
Assets on the balance sheet depreciate over time as their usefulness dries up; Greenblatt refers to these types of assets as fixed assets.
Net fixed assets equal fixed assets minus any accumulated depreciation and liabilities associated with the asset. That gives investors a sense of the real value of Google’s assets, for example, compared to reading the total asset line on the balance sheet.
Working capital equals current assets minus current liabilities, which helps illuminate if a company will continue operations in the short term.
While the magic formula ratios look minor, they communicate much information regarding Visa’s operations.
What Does the Magic Formula Take Into Account?
The information included in the magic formula:
- Earnings
- Interest
- Tax rates
- Stock price
- Debt
- Depreciation of assets
- Current assets
- Current liabilities
Let’s work through the above information to build the magic formula ratios, which will give you a better understanding of how the ratio works to sort companies.
Example
I want to use Altria (MO) for our guinea pig, which screens well according to Greenblatt’s criteria.
To calculate the earnings yield, we need the following inputs:
- EBIT or operating earnings (Income statement)
- Market cap
- Total debt (balance sheet)
- Cash & equivalents (balance sheet)
We will pull those numbers to Altria’s latest annual reports or 10-k.
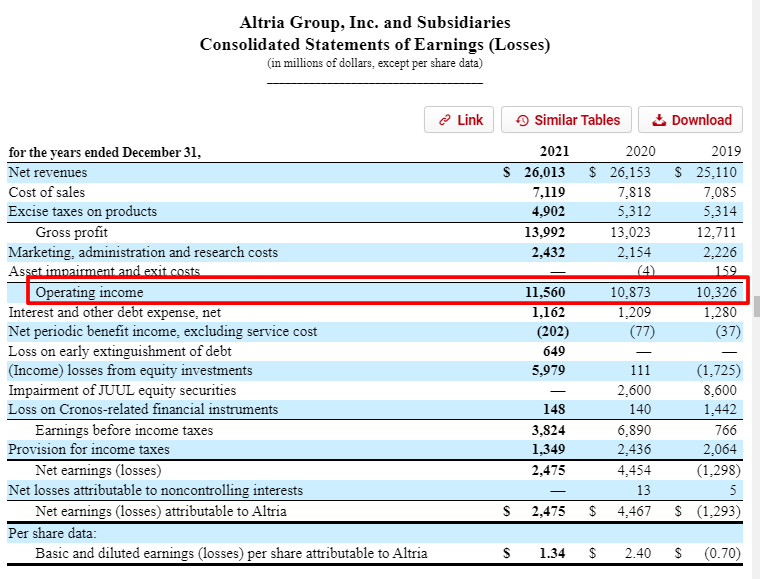
Altria’s EBIT or operating earnings equal $11,560 million; now, let’s get the information for the enterprise value.
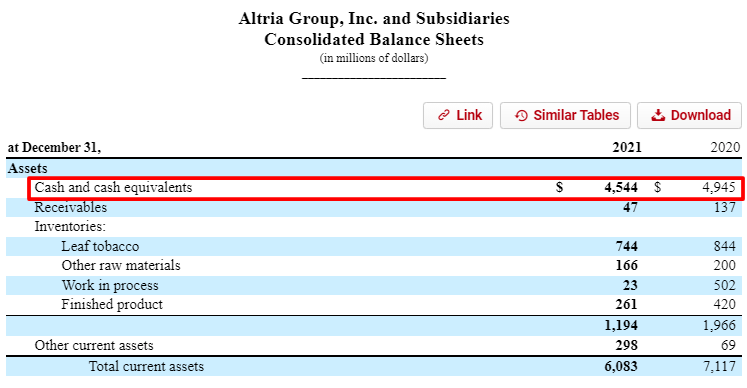
Altria’s cash & equivalents equal $4,544 million, and…..
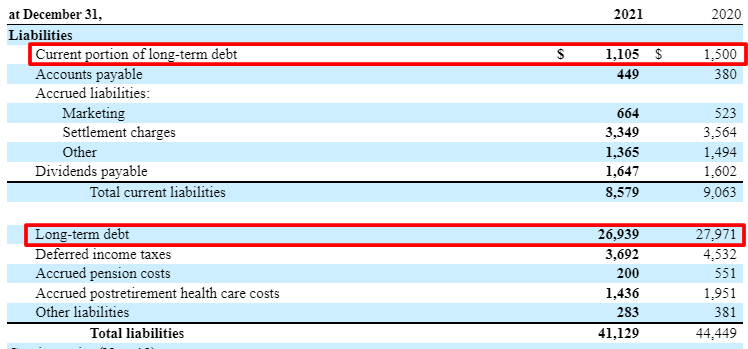
Altria’s total debt equals:
- Current portion of long-term debt = $1,105 million
- Long-term debt = $26,939 million
Now that we have all the numbers let’s calculate the earnings yield.
Earnings yield = EBIT / Enterprise Value
Before diving into the calculations, the market cap number relates to the number of shares outstanding multiplied by the current market price. You can find the share count on the income statement or the top of the 10k, or we can cheat and use your favorite financial website, Stratosphere Investing, to find it there.
Altria’s current market cap equals $86,400 million per Stratosphere Investing.
Inputs for earnings yield:
- EBIT = $11,560 million
- Market cap = $86,400 million
- Total debt = $1,105 million + $26,939 million = $28,044 million
- Cash & equivalents = $4,544 million
Now, let’s plug the numbers into our earnings yield formula.
Earnings yield = $11,560 / ($86,400 + $28,044 – $4,544 ) = 10.51%
As with most ratios, the higher, the better, and Altria has a nice earnings yield.
We need to compare the earnings yield to the return on capital.
To calculate Greenblatt’s return on capital, we need the following inputs:
- EBIT (income statement)
- Net fixed assets, which equals Net PP&E or property, plant, and equipment (balance sheet)
- Current assets less cash (balance sheet)
- Current liabilities less debt (balance sheet)
Okay, let’s look at Altria’s balance sheet and pull our numbers.
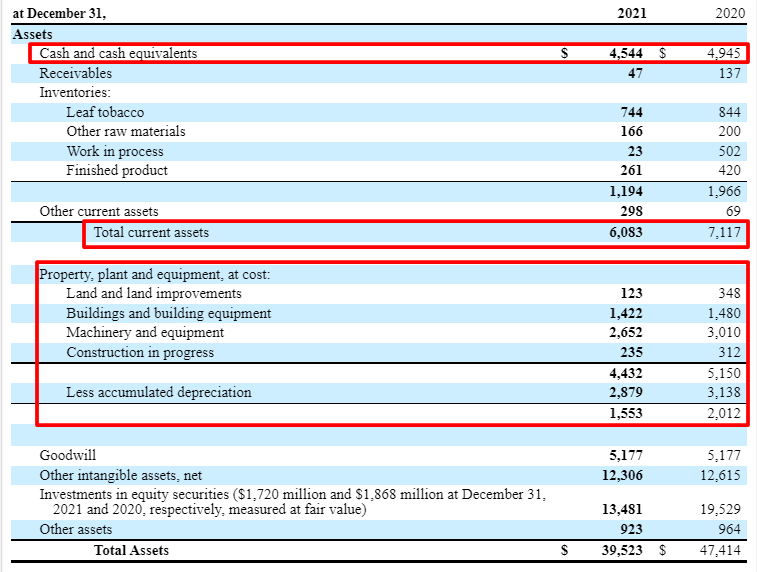
Pulling our numbers from Altria’s balance sheet, we get:
- Cash & equivalents = $4,544 million
- Current assets = $6,083 million
- Net PP&E = $1,533 million
Now, let’s look at the liability side of the balance sheet.
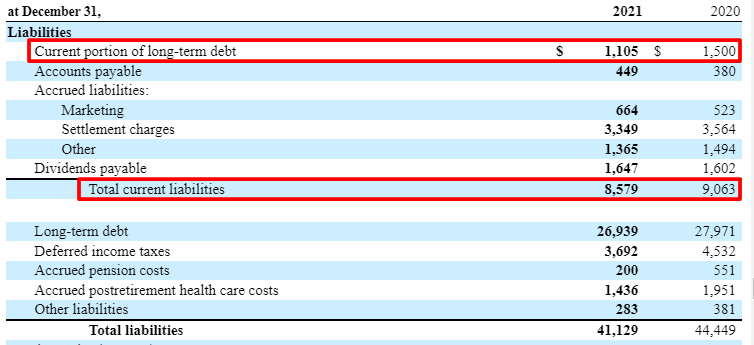
This gives us the following:
- Current portion of long-term debt = $1,105 million
- Current liabilities = $8,579 million
Putting all of this together gives us the capital side of the equation.
Working capital will equal current assets minus cash less current liabilities minus debt, which gives us:
Working capital = ($6,083 – $4,544) – ($8,579 – $1,105) = -$5,935
Capital = Net PP&E + Working capital
Capital = $1,533 + max(-$5,935) = $1,533
Now, we can divide our capital by the EBIT from above, giving us:
Return on Capital = ($11,560 / $1,533) x 100% = 754%
Altria’s return on capital seems high, but Greenblatt’s returns on capital ratios trend higher because he looks for companies generating returns based on “in-house capital.”
The negative working capital equates to zero returns on capital calculations because of how working capital works. A company with lower Net PP&E and higher current liabilities will have higher returns on capital and vice versa.
Greenblatt’s return on capital eliminates goodwill and intangible assets because he feels they represent historical costs and are irrelevant to generating profits.
Calculating the magic formula ratios helps give us better insight into a company’s earnings yield compared to its return on capital.
These two ratios tell us a story, which equals quality companies selling at a discount. For example, if we compare Altria’s numbers to Google’s, we see a disparity:
Altria’s
- Earnings yield = 10.51%
- Return on capital = 754%
Google’s
- Earnings yield = 5.04%
- Return on capital = 87.78%
Based on these two criteria, Altria looks like a better investment. Still, before pulling the trigger and putting all your money into Altria, there are other issues to consider, as with any other investments.
Does the Magic Formula Work?
The magic formula can no longer boast of the great returns Greenblatt initially found in his backtests, 30% compounded annually.
But more recent studies have shown favorable results, while maybe not as shocking, with backtests showing results from 2003 to 2015 returning 11.4% compounded annually compared to 8.7% for the S&P 500.

So, although the returns don’t match earlier backtests, it’s clear the strategy has some merit and can outperform over longer periods.
The main advantage of the magic formula for investors remains its simplicity. You don’t need to be a Wall Street-trained investor to take advantage of using the formula.
The formula allows investors to follow simple rules and helps control emotions while reducing irrational buying or selling.
However, no free lunches exist, and the strategy may not work, depending on the time frame used.
Some disadvantages or limitations remain in using the magic formula.
For example, when you buy and sell your stocks, which stocks you buy will play a part in determining your returns. For example, the initial calculations can vary from day to day. Depending on the timing, your results may vary as some companies move in and out of the top 30 or 50 that meet the formula’s criteria.
The above volatility is why Greenblatt recommends using the strategy for over five years. Due to short-term market fluctuations, investors will see better returns buying great companies at good prices over longer periods.
How to Put the Magic Formula to Work
The magic formula uses a set of screens, using the earnings yield ratio and returns on capital, which help eliminate companies and rank the rest according to the highest yields and returns.
As investors slowly build and rebalance the magic formula portfolio each year, investors can achieve higher returns.
You can build the portfolio yourself, if you want, by utilizing the above ratios to screen for the best stocks and then ranking them from highest to lowest.
The drawback to this method remains the time necessary and the sheer amount of calculations for approximately 3,500 companies.
Greenblatt created a website, magicformulainvesting.com, which makes more sense, helping investors screen quickly for companies to begin building a portfolio based on the rules.
Best of all, the website remains free to use for all.
The image below will give you a sample of what a screen would look like today.
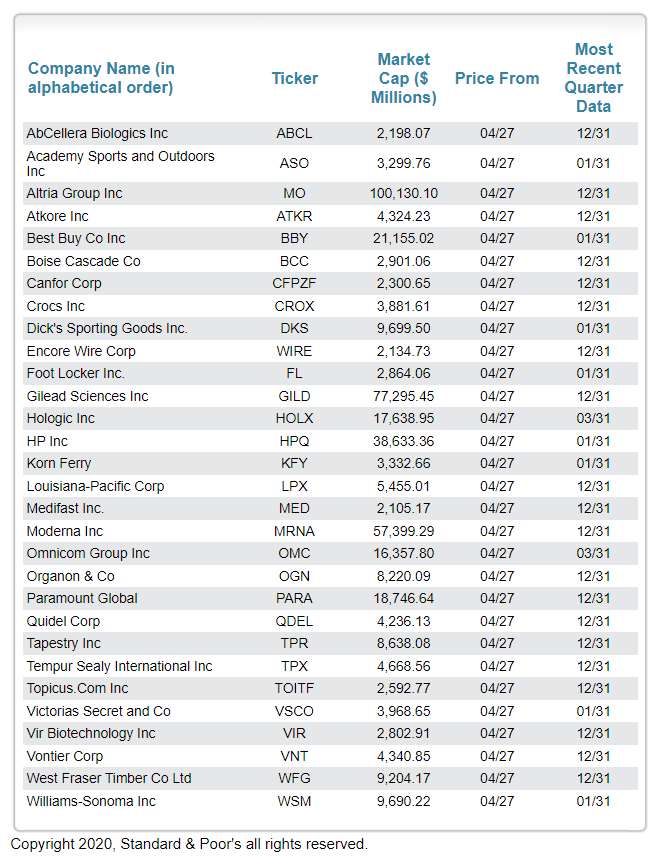
The best way to take advantage of the above chart is to begin buying three stocks each month and then, one year from now, sell any losers in the first cohort and replace those with new stocks from a new screen.
Rinse and repeat each month over the next five years.
Investor Takeaway
Greenblatt’s magic formula uses a simple, rules-based system to help average investors achieve high returns. The magic formula helps investors easily identify great companies at good prices by following a simple numbers-based approach.
The formula also helps investors avoid common traps, such as emotional buying and selling, that ruin average investors’ returns.
Even though the returns don’t equal those first reported, the magic formula can help investors beat the market if they follow the strategy for at least five years.
And with that, we will wrap up our discussion regarding the magic formula.
Thank you for taking the time to read today’s post, and I hope you find something of value. If I can further assist, please don’t hesitate to reach out.
Until next time, take care and be safe out there,
Dave

Dave Ahern
Dave, a self-taught investor, empowers investors to start investing by demystifying the stock market.
