Updated 4/4/2024
With the recent announcement that the Fed will increase its balance sheet by about $4 trillion, I thought it might be a good time to discuss the Fed’s balance sheet in depth.
In our continuing series on exploring the Federal Reserve and its history, structure, and impact on the economy, today’s news is very timely in discussing the Fed’s balance sheet.
The good news is that all the data is public knowledge and free to explore, just like any publicly traded company. Frankly, there was little interest in the Fed’s balance sheet until the Great Recession and the announcement of quantitative easing.
Once that news broke, there was more interest in the balance sheet and what assets or liabilities were added or subtracted.
Diving the Fed’s balance sheet may seem like an unknowingly deep dive, but I think you will find that it is not dissimilar to any other balance sheet of a public company. It contains all the same elements, assets, and liabilities; granted, the amounts discussed are usually larger than those of other companies.
Unlike any other business, the Fed can expand or contract its balance sheet at any time, depending on its needs. That fact alone makes it fascinating to explore.
Our goal with this article is to help you navigate the Fed’s balance sheet and understand it without getting overwhelmed.
Items we will discuss:
- What is the Federal Reserve Balance Sheet?
- Assets of the Fed Balance Sheet
- Liabilities of the Fed Balance Sheet
- Recent Trends: Federal Balance Sheet
- Repo Markets
- Discount Window
What is the Federal Reserve Balance Sheet
Like any other balance sheet, the Federal Reserve’s balance sheet breaks down the Fed’s assets and liabilities. It is also a report on the Fed’s means of stimulating the economy by injecting cash into the system.
The report that the Fed puts out weekly, typically at 430 p.m. every Thursday, is known as “Factors Affecting Reserve Balances.” It lists the assets and liabilities and provides a consolidated statement of the status of all the 12 regional Reserve Banks.
Until the 2007 financial crisis, the Fed’s balance sheet was a boring subject without much scrutiny. However, they started in 2007 with the announcement of quantitative easing in response to the financial crisis. The Fed balance sheet gave analysts insight into the scale of the Fed’s market actions. The look inside the expansionary monetary policy used during the Great Recession was particularly interesting.
Items available to view on the balance sheet:
- Level of reserve balances
- Assets
- Treasury securities
- Mortgage-backed securities
- Loans
- Liabilities
- Federal Reserve notes
- Deposits
Notice that many of the same items on a bank’s balance sheet, such as Wells Fargo, minus all the fraudulent accounts. Sorry, I had to slide that in there.
You can find the reports here.
Each report is made up of four sections:
- Factors Affecting Reserve Balances of Depository Institutions
- Maturity Distributions of Securities, Loans, and Selected Other Assets and Liabilities
- Supplemental Information on Mortgage-Backed Securities
- Consolidated Statement of Condition of All Federal Reserve Banks (The Balance Sheet)
Item four is the balance sheet; the other sections provide additional information. These sections help fill in the information gaps and give you a broader idea of the scale and scope of the Fed’s market operations.
Let’s explore each of these sections briefly.
Table One discusses everything related to the reserve balances of the Federal Reserve banks. The table is not a balance sheet, but it contains the components that come from it. Additionally, items from the Treasury’s balance sheet are included, items that may affect the reserve balances.
Of particular interest from this table are the breakouts of the assets held by the Fed, among them being the Treasurys, mortgage-backed securities, and discount window lending.
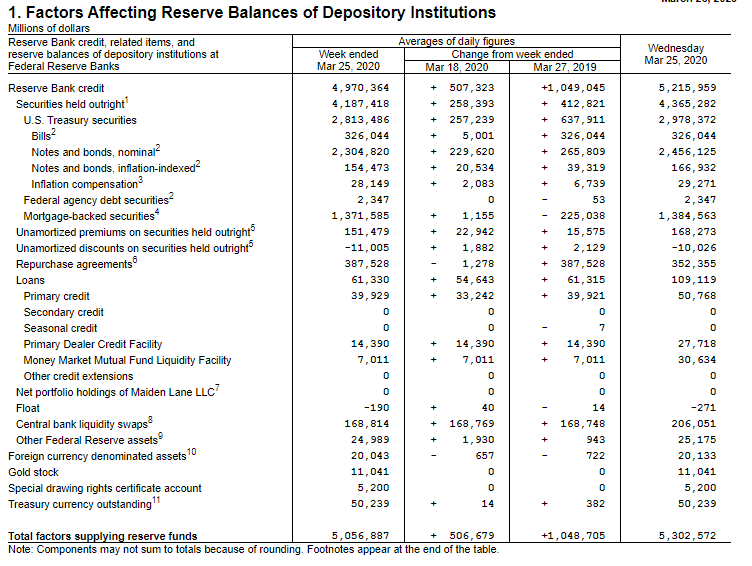
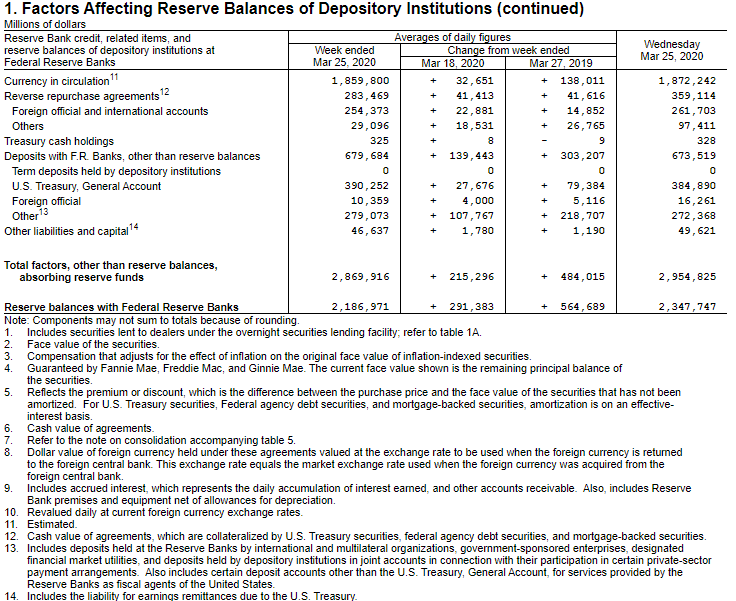
A memorandum of Table One includes information on securities held by foreign governments and businesses. The Fed of New York is the custodian of these securities, and the memorandum can give clues to the demand and interest in US securities abroad.
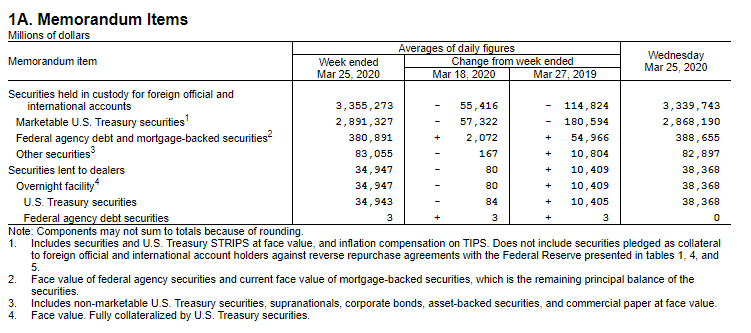
Table two is a breakout of all the maturities of securities held by the Fed.
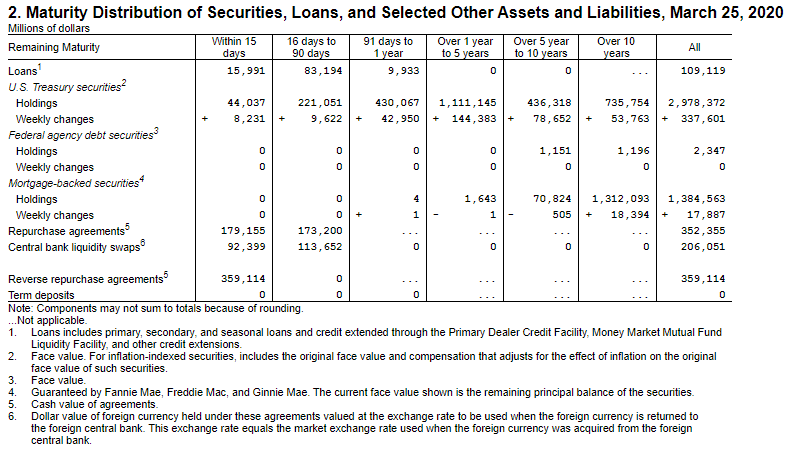
Of particular note is the length of the treasury, the majority of which is five years or less. Another cool item is that the Fed added over $337 billion to the treasury last week.
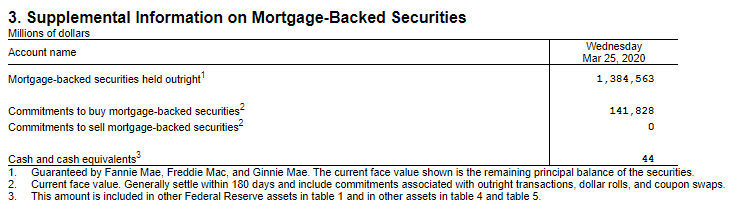
Table three breaks down the mortgage-backed securities for our review, with notes below that give more detail on the above line items.
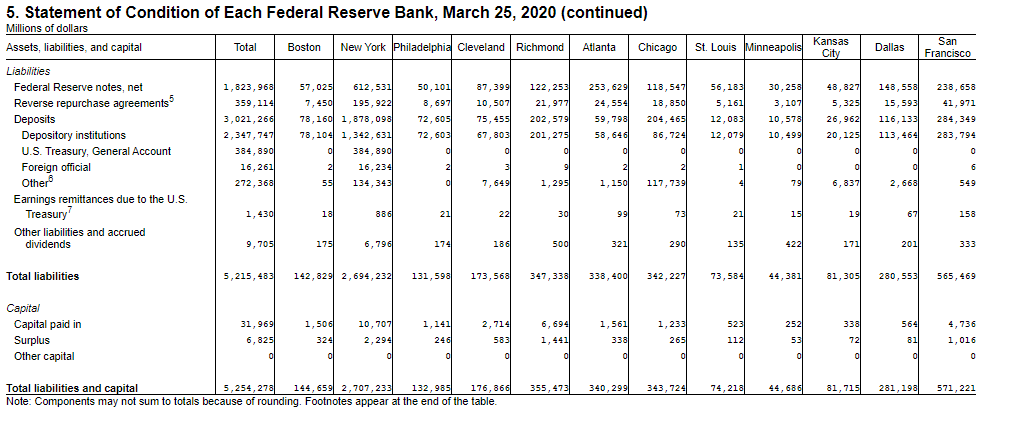
Another cool chart is the look at the financial strength of each Reserve Bank in the system.
Now that we have looked at the Fed balance sheet, let’s look closely at each section.
Assets of the Fed Balance Sheet
The Fed’s balance sheet is pretty simple; anything the Fed pays money for becomes an asset. The Fed balance sheet assets typically consisted of government securities and loans made through the discount window.
When buying Treasurys or extending loans through its discount window, the Fed pays a crediting the commercial bank’s reserve account through accounting or book entries.
In theory, there is no limit to the expansion of the Fed’s balance sheet. The Fed’s balance sheet automatically expands when it purchases assets. As we noticed above, there was an increase of $337 billion in treasury last week, an increase of 11.3% for the week. All of this is in accordance with the desire to add more credit to the existing system, hoping it will inspire more borrowing and spending.
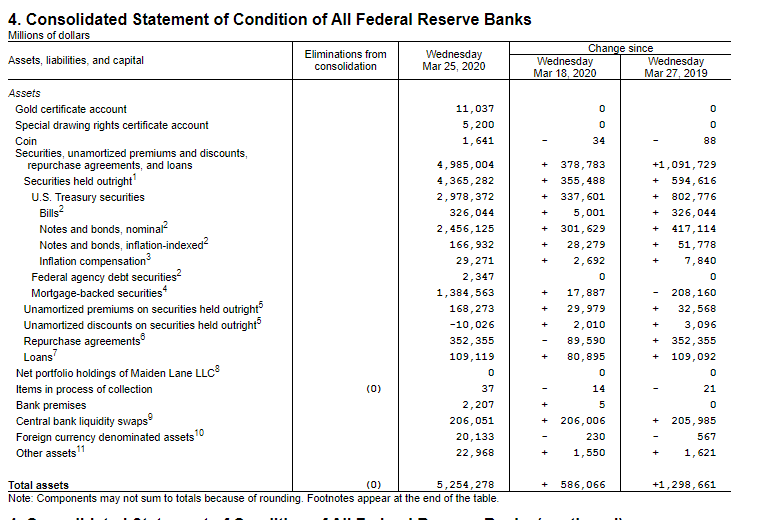
As you can see from the asset side of the balance sheet above, over the last two weeks, there has been an increase in buying Treasurys and smaller amounts of others, such as mortgage-backed securities.
What I like about this is we can see the money being created to be added to the Reserve system through large purchases of Treasurys. Also, notice in the notes that all mortgage-backed securities are guaranteed by the federal institutions Fannie Mae, Freddie Mac, and Ginnie Mae and that they are for the face value of the loans; no interest is included in the balance sheet.
Now, let’s move on to the liabilities side of the balance sheet.
Liability Side of the Fed Balance Sheet
A few of the Federal Reserve’s major liabilities are its notes, or paper currency, and the deposits of thousands of commercial banks.
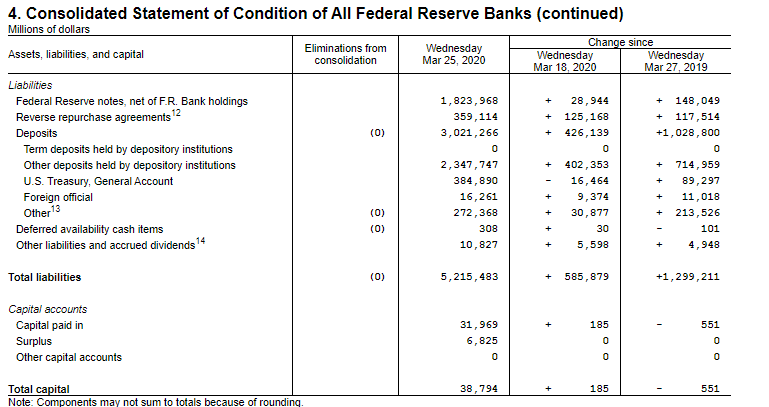
With the Fed’s aggressive actions of purchasing more assets, there has been an increase in the liability side of the equation, particularly regarding deposits to commercial banks.
More than 5,500 banks maintain accounts with the Federal Reserve. Many of them borrow and lend according to the Fed funds rate, which we now move from the Reserve to commercial banks for lending to customers.
An increase in the Reserve’s securities holdings also increases banks’ deposits. When the Fed buys securities on the open market or through repo operations, it credits the money to the Reserve banks.
During the Great Recession, the Fed opened up its open-market purchases of Treasuries to expand the Reserve banks’ balance sheet by injecting more money into the system. The actions were reflected on both the asset and liability sides, with the addition of assets via Treasurys and the increase of deposits with the Reserve banks.
As with any company, there is a balancing act to the balance sheet for the Fed as it adds assets either through the purchase of Treasurys or mortgage-backed securities. A corresponding liability is accounted for, like a deposit added to the Reserve Bank, which is then distributed into the economy as a loan when you buy a car.
A note about the liabilities of the balance sheet: unlike assets, which have no theoretical limit, there is a limit to the contraction of the liabilities on the Fed balance sheet. As assets back up all liabilities, once the money is spent, it is gone, and the Fed can only create more money by buying more securities, for example. Still, unwinding the liability side of the balance sheet involves either writing off the asset or letting the Treasurys expire.
Recent Trends: the Fed Balance Sheet
The balance sheet has undergone considerable turmoil since 2007. At the beginning of the financial crisis, the total assets were $870 billion. They increased to a final total of $4.5 trillion as of 2015; then, the assets stabilized for a few years before the balance sheet unwinding to a total of $3.8 trillion by August 2019.
However, in September 2019, total assets started to increase gradually with the addition of more securities purchases to inject more liquidity into the market.
Of course, we reached the current situation in March 2020 and the complete market meltdown with the coronavirus pandemic. As of the beginning of the year, the market is currently down approximately 21% by the S&P measure.
The Fed has begun an aggressive move to prop up the economy by first using its first tool, which was to lower interest rates to a Fed fund target of 0 to 0.25%. When that failed to do much, the Fed next announced that it would inject about $5 trillion into the economy by buying securities on the open market.
The addition of that many assets is beginning to increase the liability side of the Fed’s balance sheet, which includes deposits that banks can lend to their customers.
The unprecedented use of such aggressive monetary policy expansion has stabilized the markets. Still, many think that this expansion at all costs will have long-term consequences in the devaluation of the currency. The thought is that this could cause a huge increase in inflation, and with interest rates at record lows, there is no weapon against inflation. Ultimately, that could be far more devastating than the current market meltdown.
But putting the cap back on that box once the Fed opens Pandora’s box under Bernanke’s leadership will be extremely difficult. I fear this expansion of monetary policy will continue indefinitely.
Repo Market
Repo markets or repo operations have garnered a lot of scrutiny lately, with the blowup of the repo markets early in September 2019.
So, what is a repo agreement?
According to Investopedia:
“A repurchase agreement (repo) is a form of short-term borrowing for dealers in government securities. In the case of repo, a dealer sells government securities to investors overnight and buys them back the following day at a slightly higher price. That small difference in price is the implicit overnight interest rate. Repos are typically used to raise short-term capital. They are also a common tool of central bank open market operations.”
The party was selling the security and agreeing to repurchase in the future; it is called a repo. For the buying side of the agreement, agreeing to sell it in the future is a reverse repo.
Repos are usually considered safe transactions because the instrument traded is a Treasury, which functions as the collateral. Repo purchases are considered a money-market instrument, a short-term, interest-backed loan.
The buyer is the short-term borrower, and the seller is the short-term lender. Safety comes in the form of collateral, which satisfies both the borrower and lender by securing funding and liquidity.
Repo agreements can occur between many parties; the Fed Reserve regulates the money supply and reserves.
The Fed uses repos as another tool to regulate the money supply in the economy. The Fed conducts reverse repos when it sells Treasury and federal agency debt securities to parties who agree to sell them back to the Fed at a future date.
In normal times, the Fed doesn’t involve itself much in the repo market. During the financial crisis of the fall of 2008, the Fed used the repo market to sell Treasurys to primary dealers, which increased the reserve balances and the Fed’s liquidity. However, the more important effect of the transactions was to make more treasuries available to private agents to use as collateral to help improve the struggling money market accounts.
Repo agreements continued throughout the financial crisis and beyond, and in 2015, the Fed decided to add them as a regular instrument of use during normal operations.
Currently, repo operations are used by the Fed as a tool to help control the Fed funds rate within the target range established by the FOMC. All repo agreements are conducted by the Federal Reserve Bank of New York, where all buys and sells of Treasurys occur in the Fed Reserve system.
The repo agreements are considered part of the expansionary monetary policy the Fed established in 2008 and continues to pursue today.
Tables One, Two, and Four in the Fed’s balance sheet provide more information about the weekly activity of the repo agreements.
Discount Window
As a source of lending of the last resort, the Fed established the discount window. Banks that cannot borrow from other banks in the Fed funds market can belly up to the bar and borrow from the discount window at the Fed discount rate.
The Fed’s discount window is a short-term lender (overnight) that provides liquidity to banks that cannot borrow from other banks, mainly because they are viewed as too weak to loan money.
A downside of the discount window is that the rate is higher than the fed funds rate, another reason it is considered the lender of last resort.
Discount window loans are collateralized overnight loans with a higher interest rate than the Fed funds rate. These funds are also available to foreign banks.
Banks only borrow from the discount window when facing a short-term liquidity squeeze and need cash quickly. They prefer to borrow from the fed funds rate because the money is cheaper, and borrowing from the discount window is perceived as weak.
Because of the discount window’s nature, you normally see an uptick in activity during times of financial turmoil, like today. As banks face more pressure and liquidity issues with the market downturn, you can bet more activity will be in the discount window in the coming months and years.
In 2008, banks borrowed $403.5 billion at the discount window, compared to $3.4 billion during the dot.com bubble, which burst in September 2001.
There are three rates that banks can borrow from:
- Primary credit—the first rate is for financially good-standing banks. The collateral is waived, and the interest rate is generally lower than the other two options. The short-term credit, typically overnight, provides a secondary funding source if the market rates jump overnight.
- Secondary credit—This second rate is 50 basis points above the primary credit rate and is provided to banks not eligible for it. Secondary credit has more restrictions and oversight than primary credit and is typically short-term or overnight.
- Seasonal credit—This line of credit allows small banks to help manage seasonal swings in their loans and deposits. Eligible banks may borrow for periods of seasonal issues, and the rates are floating. These types of loans are only extended to banks that have exhibited consistent seasonal patterns.
All loans utilized by banks from the discount window are listed on the Fed’s balance sheet under the assets section as loans. Table One of the balance sheet also breaks down each type of credit.
Final Thoughts
The Fed’s first actions during this current market crisis were to try to inject funds into the repo market, as there was a liquidity crunch. The Fed tried to create more liquidity by offering more Treasurys for purchase.
The next tool they unpacked was lowering the fed funds rate target from a full basis point to 0% to 0.25%, hoping that creating more money in the market, buying up all the Treasurys, and creating more credit in the Reserve system would help stabilize the crashing markets.
It didn’t seem to make much difference then, but now they have embarked on a no-hold-barred effort to create money at all costs. They feel that flooding the market with as much liquidity as possible will help prop up companies getting butchered.
For those living under a rock, the S&P has decreased by over 30% in the last few weeks, the quickest drop in the stock market’s history. With the economy at a standstill because of the Coronavirus pandemic, there is a lot of fear in the world and markets.
The Fed has opened its balance sheet and told the world that it would do whatever it takes to stop the next depression from happening on its watch.
The transactions on the Fed’s balance sheet each week show that the asset side of the equation goes straight up.
What effect will all of this have? I am unsure, as I am no economist and cannot tell you the future. I know we are in uncharted territory right now, and time will reveal the effects of this.
My goal with this series of articles was to lower the veil on the Federal Reserve system and hopefully help you see what kind of impact the central bank can have on our economic system. Do you need to be an expert on the Fed to be a good investor?
No, but I think a little understanding can help you better understand the impact that interest rates and the creation of more money can have on the market.
Think about the companies struggling right now as they took on more debt because it was cheap and primarily for buying more stock to line their pockets; I am looking at you: Boeing, McDonald’s, and Caterpillar.
I appreciate your time reading this article and hope you find it useful.
If I can further assist, please don’t hesitate to reach out.
Take care and stay safe,
Dave

Dave Ahern
Dave, a self-taught investor, empowers investors to start investing by demystifying the stock market.
