Updated 9/25/2023
Operating lease accounting can be confusing. Especially when you have to sift through multiple financial statements to quantify its impact.
The latest FASB (ASU 2016-02) rule has now made operating leases more transparent. It has required its inclusion in the balance sheet.
In this post, we will cover [Click to Skip Ahead]:
- Financial Lease vs Operating Lease Accounting
- Balance Sheet Example: Operating Leases
- Impact of Operating Leases
- Operating Leases in the Income Statement
- How New Operating Lease Accounting Could Greatly Distort ROA
But first, some background on operating leases and its new accounting standards for companies post-2018…
Financial Lease vs Operating Lease Accounting
There’s a difference between financial lease accounting and operating lease accounting, though the new FASB (ASU 2016-02) rule established in 2018 has made them more similar.
A simple way to remember operating vs. financial leases is that a financial lease includes payments that eventually lead to an asset. Think of it like a mortgage. An operating lease includes lease payments but doesn’t lead to an asset at its termination, like renting an apartment.
Now, both types of lease expenses eventually find their way to a company’s income statement. And now with the new 2018 FASB change, you’ll see both in the balance sheet as well.
This could have major implications for businesses in the retail industry, particularly if they rent most of their stores rather than own them.
Balance Sheet Example: Operating Leases
Remember that in basic accounting, assets and liabilities must be reconciled. As an example, if a company takes out debt, they get the cash from the debt as an asset, and the new debt as a liability.
For leases, whether financial or operating, the assets and liabilities also reconcile.
Because the company isn’t paying these expenses for nothing, they get benefits from them and record them as assets on the balance sheet (operating lease right-of-use assets). The liabilities that they owe over the life of the lease are also recorded (operating lease liabilities). These figures must be reconciled.
In the case I will show here, the company has recorded a line item as “operating lease right-of-use assets.” The company has split the liabilities into 2 line items: “Current portion of operating lease liabilities” and “non-current operating lease liabilities”.
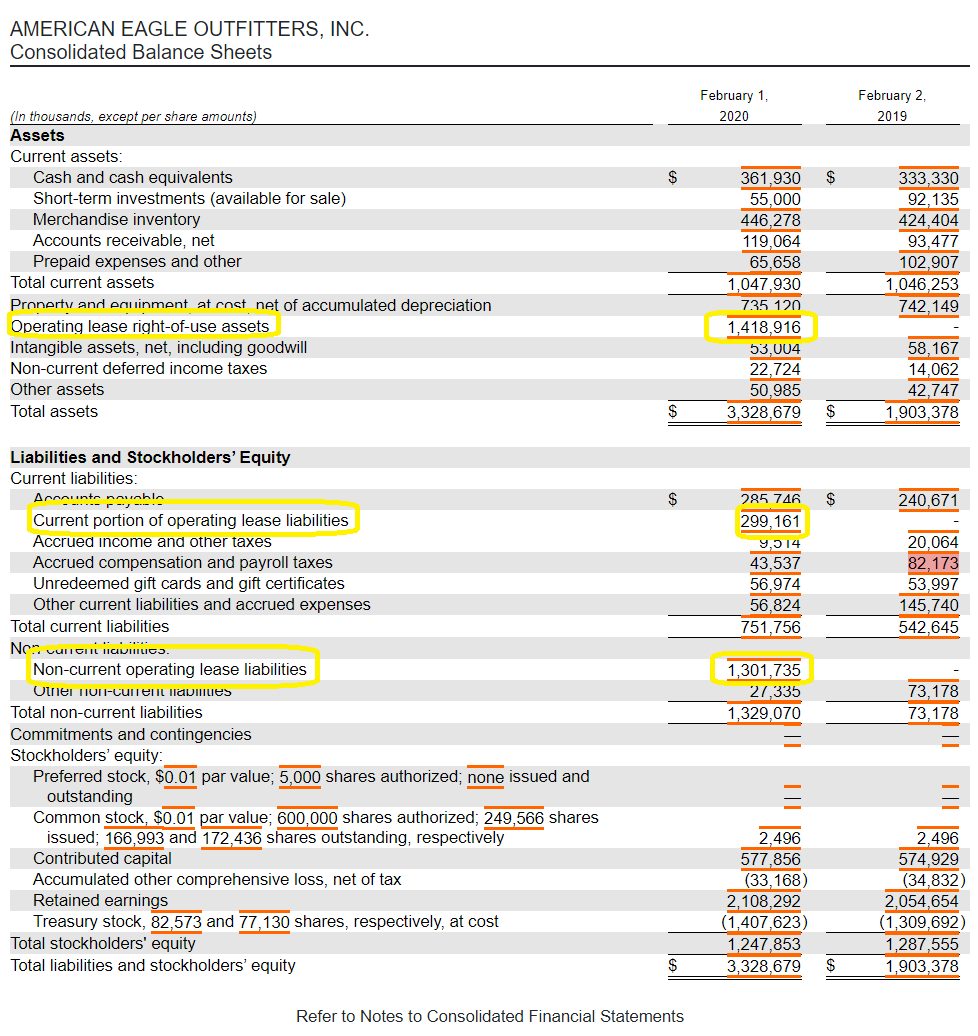
Click to zoomThe right of use (ROU) assets and total operating lease liabilities don’t exactly equal here. Notes from the 10-K explain that disclosing that impairment was taken on some of the ROU assets due to impairment on some store assets. You can see the figures are very close, however.
Note that these operating leases made up 42.6% and 76.9% of the company’s total assets and total liabilities, respectively. This is expected for a retail company like $AEO (especially one based on very expensive mall traffic), which reported in their 10-K that:
“We ended Fiscal 2019 with 1,312 stores, consisting of 1,095 Company-owned stores and 217 licensed store locations… Our Company-owned retail stores are located in shopping malls, lifestyle centers, and street locations in the United States, Canada, Mexico, and Hong Kong.”
This gives us additional insight, mainly that:
A debt-free company might not be as risk-free as it seems, as additional risks, such as significant contractual obligations, can become hard to fulfill in a tough economic environment.
Good on the FASB to establish operating leases in the balance sheet as the latest GAAP standard. These additional risks have always been there, but they are now in the forefront.
Let’s take another example of a big retailer: Walmart.
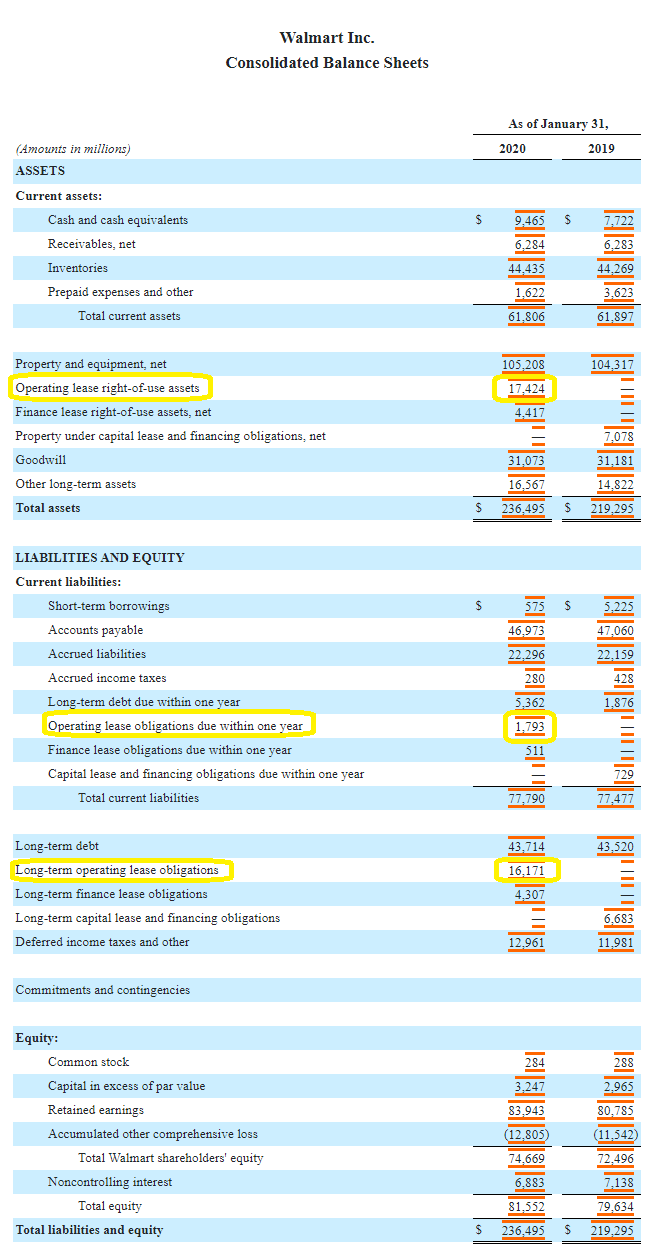
Like with $AEO, the company implemented the new FASB (ASU 2016-02) rule in this 10-k. They reported operating lease assets and liabilities recorded in the balance sheet for fiscal year 2020 but not the year prior (2019).
Operating leases as a percentage of Total Assets for its ROU assets were 7.4%. This indicates a business model much less weighted down by leases on its stores and more on things like Accounts Payable.
Note that in the 10-K, the company reported 6,688 properties owned and 5,221 leased. However, in the U.S., those figures (which likely contribute a large amount to overall expenses) were 4,701 owned and 841 leased.
The Year-to-Year Impact of Operating Leases on a Company
Looking at the balance sheet is great and all, but just the base figure or even percentage of assets for operating leases doesn’t tell the entire story.
Those numbers could be very unequal.
A company with a 5-year term on their leases, for example, could have higher liquidity needs in the short term than a company on a 10-year lease—even if the 5-year lease ends with a lower total operating lease figure on the balance sheet than the 10-year.
Here’s where the shortcut comes in.
You can usually find an obligations or contractual commitments section in the 10-K by simply searching the term “obligations” (use “Ctrl+F” to do this quickly).
Let’s go back to the $AEO 10-K, which disclosed these in their Obligations and Commitments section:
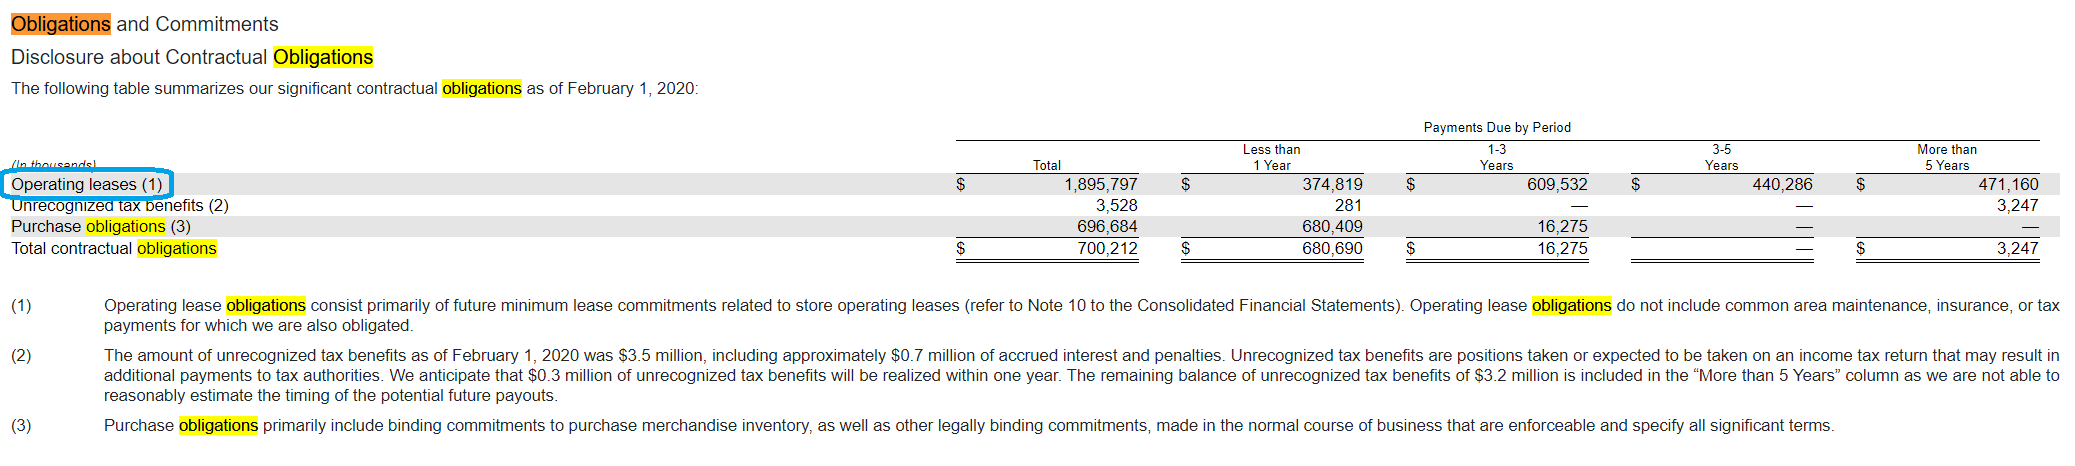
Note that, again, the operating leases in the blue didn’t exactly reconcile with the figures in the balance sheet. However, the company made a note of this in the 10-K which I’ll quote here:
“Upon adoption, the Company:
• Recognized operating lease liabilities and operating lease ROU assets of $1.6 billion, for the present value of the remaining minimum rental payments on existing operating leases (including consideration related to non-lease components due to the related practical expedient).
• Recognized a transition adjustment of $44.4 million (net of tax effects of $15.0 million) to beginning retained earnings related to the impairment of newly recognized operating lease ROU assets related to store assets that were impaired prior to the date of adoption.
• Reclassified $82.9 million of straight-line deferred rent, $55.0 million of deferred lease credits, and $40.4 million of prepaid rent to the operating lease ROU asset. Combined with the impairment discussed above, these reclassifications reduced the net operating lease ROU asset to $1.4 billion. Corresponding amounts were not reclassified in prior periods as those prior periods are presented under ASC 840, Leases.”
Operating Leases in the Income Statement
Let’s turn to the income statement next—which is good for seeing how operating expenses have affected the bottom line in the past.
To find operating leases in the income statement, we’ll have to be intelligent about it.
Because there seems to be some leeway on where these expenses are included in the P&L, we have to understand that companies may place them in different sections, and not necessarily as its own line item.
Knowing the Short-term obligations figure (from the previous section) can sometimes help in this determination, as it gives us a ballpark estimate on how much the company tends to spend on operating leases per year.
Here are two examples with operating lease accounting in the income statement included in two separate places:
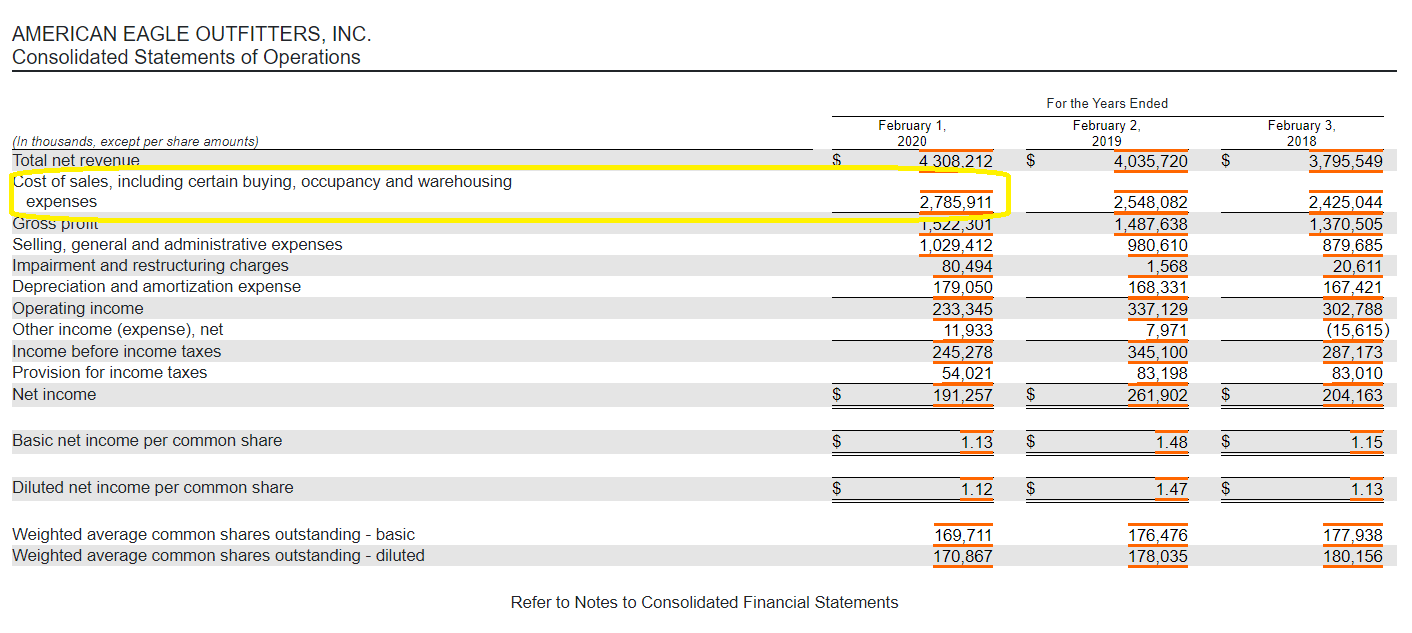
$AEO again is a great example here, as it seems they chose to include their operating lease expenses in the “Cost of Sales, including certain buying, occupancy, and warehousing expenses” line item.
Note that operating leases due in Less than 1 Year were at $374,819, and those in succeeding years a bit lower than the average. Really then, the operating leases could’ve fallen under the Cost of Sales ($2,785,911) or the “Selling, general, and administration expenses” ($1,029,412), as we’ll see in example #2.
The type of business tends to influence how a company chooses to categorize their operating lease expenses (in the income statement).
Operating Leases in Administration Expenses
Compare and contrast example #2, Value Line $VALU, to $AEO. Value Line doesn’t have physical stores to serve customers but rather keeps office space for employees. $AEO relies on its stores and foot traffic to directly drive revenues, which most likely explains the inclusion in Cost of Sales.
In this example, the Contractual Obligations section for $VALU disclosed that Operating Lease Obligations due in less than 1 year are just $1,399 (in thousands), with future obligations averaging around that figure for the next 1-5 years.

Looking at their income statement, the only expense that really makes sense for the operating lease expense seems to be the Office and Administration line item, which recorded a charge of $4,435 (in thousands) and is a high enough number to indicate the expense was likely recorded here.
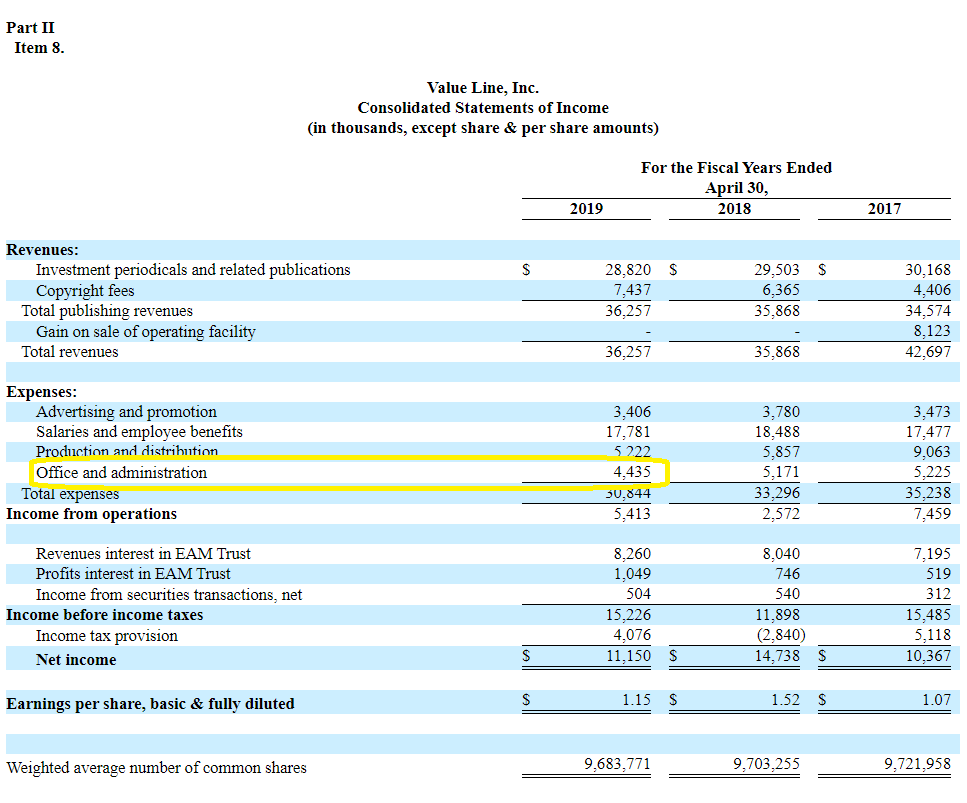
However, I’ll note that this 10-K by $VALU was one released without the FASB (ASU 2016-02) in place yet.
The vagueness of operating lease accounting in the income statement could’ve been a main reason for the push to include it in the balance sheet moving forward.
How New Operating Lease Accounting Could Greatly Distort ROA
Let’s go back to the $AEO screenshot at the very top of this post to illustrate the final impact to the new balance sheet operating lease accounting inclusion.
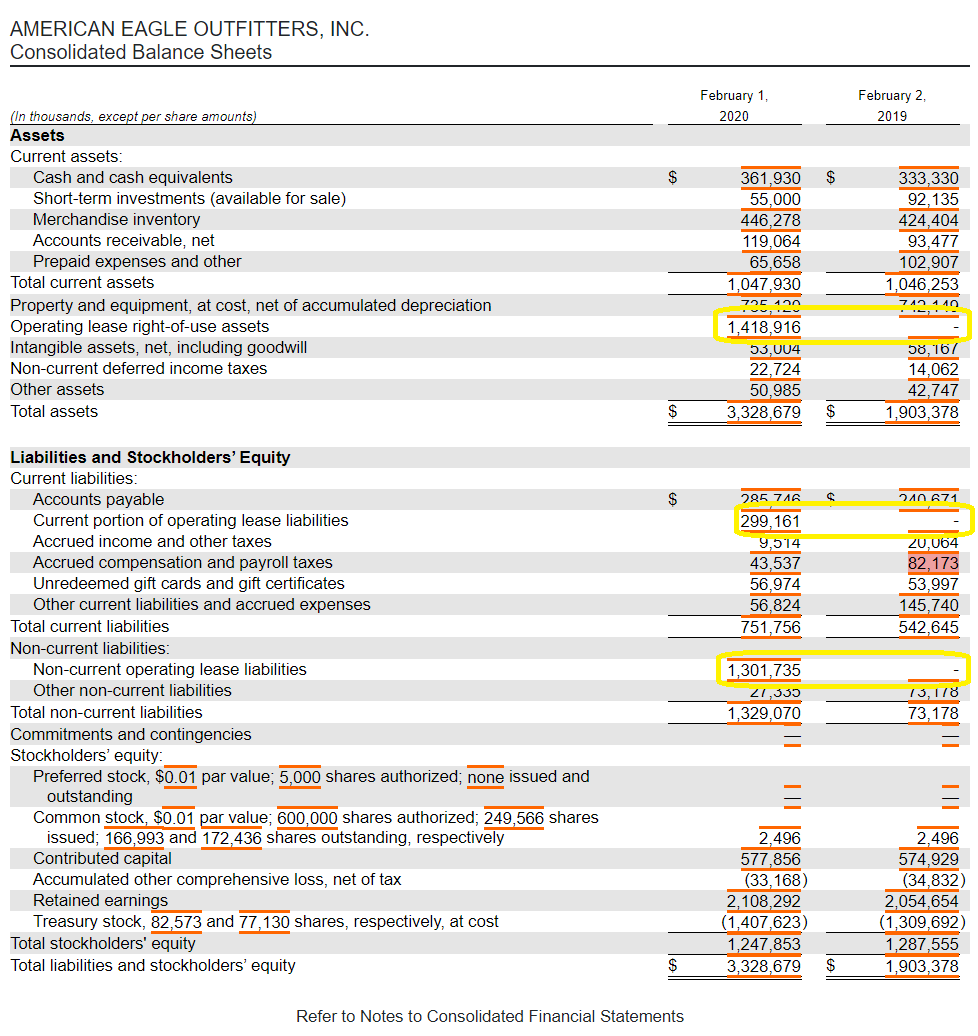
I’ve now highlighted the difference between 2020 and 2019 to illustrate the impact on the balance sheet of the adoption to the FASB (ASU 2016-02) rule.
Notice especially how the Total Assets and Total Liabilities have changed, while nothing inherent about the business has changed at all.
These accounting changes impact the income statement slightly but change Total Assets and Total Liabilities immensely, especially for brick n’ mortar retailers. Metrics that involve Total Assets without including the counter-balancing Total Liabilities will see huge distortions.
Total Assets and Liabilities Change, While Other Metrics Do Not
For example, Return on Assets (ROA) takes the Net Income and divides it by Total Assets. This ROA figure will decrease greatly for AEO, even though their ROE and ROIC won’t be affected by the new FASB adoption.
So, this inequality could lead to a misunderstanding of the changing economics of a business or businesses over this adoption period. It could permanently alter the average ROA for certain industries.
Debt to Total Assets or Equity to Asset ratios are other metrics with the possibility to face distortions by this new implementation.
Those metrics that include both Total Assets and Total Liabilities in their equations (such as Debt to Equity), or those solely including Shareholder’s Equity with Income Statement or Cash Flow Statement figures shouldn’t be affected. The impact of FASB (ASU 2016-02) is automatically absorbed in their formulas.
Investor Takeaway
The next logical step is to incorporate this information with other important models, such as those that involve financial statement forecasts.
I highly recommend reviewing Cameron Smith’s phenomenal 3-part series on each of these critical statements. It will help you to create forward-looking P/E estimates, valuations, and profitability and cash flow analyses:
- Income Statement Forecasting: The First Step of a 3-Part Financial Model
- Balance Sheet Forecasting: An Essential Part of a 3-Part Financial Model
- Cash Flow Statement: The Final Stage of a 3-Part Financial Model

Andrew Sather
Andrew has always believed that average investors have so much potential to build wealth, through the power of patience, a long-term mindset, and compound interest.
