Purchase obligations can be a key part of understanding future cash flow. In 2002, the SEC made the disclosure of purchase obligations (POs) a requirement in the MD&A section of the 10-k. Because POs are not part of GAAP, I’ll discuss the two ways they can affect future financials of a company.

While Purchase Obligations is the official term used by the SEC, you can also think of a Purchase Order (PO) as essentially the same thing, as it’s a contract to purchase goods and services from another company or vendor.
The Basics of Purchase Obligations/ Purchase Orders (POs)
How this fits into normal GAAP accounting is simple enough.
Say you’re a manufacturer of machines, and you need to purchase steel to make those machines. Once writing a PO with a steel supplier, you might see the following impacts to the Balance Sheet:
Part 1: Purchase order = $100m for 2 units of steel
Balance Sheet
- Accounts payable = +$100m
- Inventory (raw materials) = +$100m
Remember that Accounts Payable is a current liability, and represents a cash outlay that needs to be made in the next 12 months. Inventory is a current asset, and can be converted to future revenue once the machine is built and sold to a customer.
Notice how all accounts reconcile with each entry, which is Accounting 101. For a really good example of this, where the author gives you through the entire accounting process (from manufacturing, to selling, to future investment through every financial statement) on a simple, fictional start-up company process, I highly recommend the book Financial Statements: A Step-by-Step Guide to Understanding and Creating Financial Reports (hat tip to Jae Jun from OSV).
Part 2: Cash changes hands
Once the Purchase Order becomes a transaction where the cash finally changes hands, you’d see this impact to the financial statements:
Balance Sheet
- Accounts payable = -$100m
- Cash and Cash Equivalents = -$100m
Cash Flow Statement
- Accounts payable = -$100m
This reduces Cash from Operations by $100m, which is correct because the cash was used in order to create an inventory unit which can be sold later.
Also notice how the timing of the PO affects which financial statement is impacted when. So when the PO is created, you see the inventory and accounts payable added to the Balance Sheet, representing the entire transaction.
But until cash trades hands, this doesn’t show up in the Cash Flow Statement.
Once that cash changes hands, you get the subsequent effect in the Balance Sheet (of cash and accounts receivable reducing, remember that inventory in the Balance Sheet was already added), and you also get the Cash Flow Statement effects (which match the original Balance Sheet effect).
Part 3: Inventory is Sold
Once the inventory is sold (ideally at a higher price than what it cost to manufacture), you’ll get the following:
Balance Sheet
- Cash and cash equivalents = +$150m
- Inventory = -$100m
Income Statement
- Revenue = +$150m
- Cost of Goods = -$100m
- Operating Income = $50m
The Cash flow statement will reflect the inflow of cash +$150m, with the Cost of Goods already paid for in the Cash flow statement in Part 2. This leaves $50m in Cash from operating activities, which in this case matches the Income Statement’s Operating Income.
Note that I left out the “accounts receivable” part of this equation which is similar to accounts payable but when our company makes a sale, just for simplicity sake. The process is relatively simple to parse out like we did for accounts payable, and flows through the cash flow statement in the same way.
Alternate Scenario: Inventory Sits
Or, if the inventory isn’t sold for the year, then it will sit as inventory on the Balance Sheet to be sold in a future year, and increases working capital like this:
Cash Flow Statement
- Changes in working capital, inventories = +$100m
From a cash flow standpoint, the company’s value hasn’t changed. We’ve just exchanged $100m in cash for $100m in inventory. Once that inventory is sold, then it gets converted into future cash flow like we saw in Part 3.
But if the product doesn’t sell, then the inventory gets written down and becomes a loss for the company. In that case, the impact of written down inventory looks like this:
Cash Flow Statement
- Changes in working capital, inventories = -$100m
Income Statement
- Cost of Goods sold = +$100m
Balance Sheet
- Inventory = -$100m
In this case there’s no reconciliation, the company simply lost money due to poor business conditions, poor inventory decisions, or both. If the loss is big enough, then it results in negative net income, which flows through into Negative Retained Earnings which lowers the value of the business.
Long Term POs Present a Problem
The problem with this nice and easy accounting entry of Purchase Orders/ Obligations, which is totally covered by GAAP by the way (as we saw with the impacts to financials above), is that sometimes Purchase Orders are signed as Long Term contracts spanning multiple years.
In that case, there’s no current accommodation in GAAP accounting to represent this contract even though it’s a real liability to the company in the future.
It was for that reason that the SEC required Purchase Obligations as part of Long Term Contractual Obligations that are “Off-Balance Sheet”.
That’s great news, but it’s up to us as analysts to sniff out these Purchase Obligations, and project future cash flows by determining whether a PO will impact next year’s financials (the Balance Sheet and Cash Flow Statement), or future financials (capital expenditures which suppress future cash flows).
This important detail is something not currently covered by GAAP or the SEC, but represents a real business situation and could presage future cash flow issues.
How the SEC Defines Purchase Obligations (as part of Off-Balance Sheet Contractual Obligations)
You can find the official documentation on “Off-Balance Sheet Arrangements and Aggregate Contractual Obligations” as part of the MD&A (management’s Discussion and Analysis) of the 10-k from the SEC here.
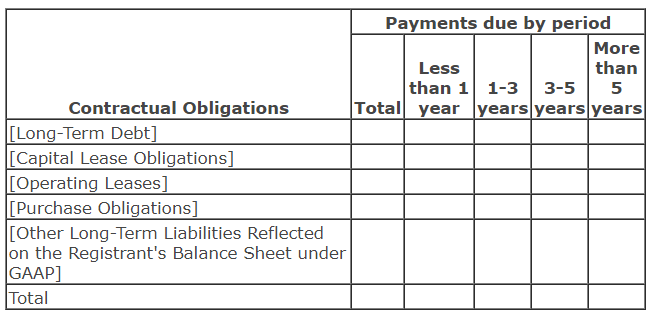
In this requirement, every company has to disclose the following off-balance sheet items in their MD&A:
- Long term debt obligations
- Capital lease obligations
- Operating lease obligations
- Purchase obligations
- Other long-term liabilities (on GAAP Balance Sheet)
A sample table, which the SEC also provided, can be seen here:
Then the SEC describes how GAAP doesn’t currently require the disclosure of purchase obligations, especially when used over the long term (as capital expenditures).
To get at the root of POs, we need to define Purchase Obligations. Their official definition of a purchase obligation (amended from its original definition), as the following:
A “purchase obligation” is defined as an agreement to purchase goods or services that is enforceable and legally binding on the registrant and that specifies all significant terms, including: fixed or minimum quantities to be purchased; fixed, minimum or variable price provisions; and the approximate timing of the transaction.
Notice how there’s no distinction between POs lasting less than 1 year (which will show in next year’s financials), and POs that span multiple years (which should be accounted as capital expenditures over several years).
While not traditionally taught in textbooks (at least I couldn’t find it), I believe we can sniff this out with most companies, using some good old-fashioned investigative work and intuitive decision making.
Purchase Obligations as Expenses (COGs) vs Capitalized Expenditures (Capex)
Let’s take a company that’s currently in the S&P 500 and manufactures electrical interconnects, Amphenol Corp ($APH).
As part of the company’s business model, Amphenol must purchase raw materials, like Gold and Steel, from various suppliers and then use its manufacturing facilities to assemble and produce products that are eventually shipped to customers like Apple and electronic manufacturing service (EMS) companies.
Starting from the 2018 10-k which reports the 2017 Fiscal Year, here’s the company’s upcoming Purchase Obligations as reported in Disclosures about contractual obligations and commitments of their 10-k. You can follow along at home by searching (“Ctrl+f”) for the word “obligations”.
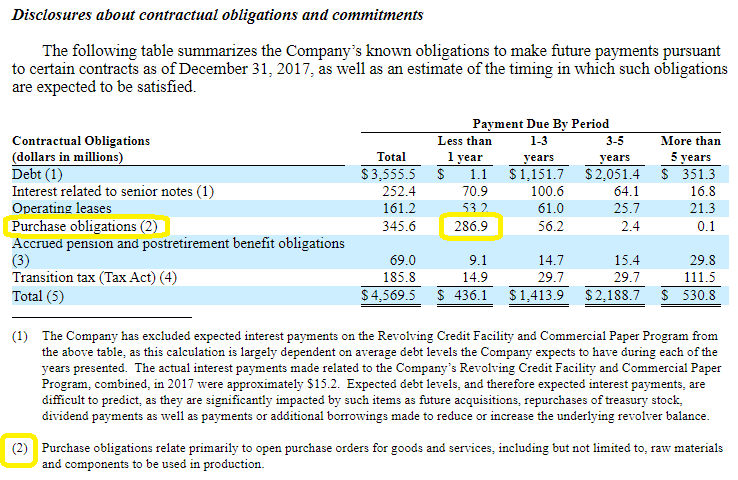
We can see the footnote for the Purchase obligations line item explains that POs include the necessary supplies to create sellable inventory, such as materials and components.
In this case, it’s safe to say that the $56.2 million in the 1-3 years column will probably be attributed as Capital Expenditures, though I don’t think we’ll ever know for sure.
The Cash Flow Statement shows us that the regular range for Capital Expenditures for the company has been around $170m – $220m per year over the last 3 years.
Searching for “capital expenditures” in the 10-k, we can also suss out the following comment from management about planned capex:
“The Company expects that capital expenditures in 2018 will be in a range of 3% to 4% of net sales.”
A range of 3-4% of net sales would be around $170m – $280m according to the previous 3 years of net sales for the company, which falls in-line with what they’ve spent previously.
Since capital expenditures are in that ~$200m per year range, and $56.2 million spread out over a 1-3 year time period would come out to $20-$25 million per year, I don’t see focusing on those capital expenditures as a prudent use of our time in analyzing a business. It’s just too small.
But, what’s more interesting is the $286.9 million that’s due in Less than 1 year, which I highlighted in the screenshot above.
Example: Company Should Have Plenty Future Cash Flow
In this case, the amount for $APH is close to historical average capex, so I don’t think investors will see any surprises.
Where analysts and investors should get concerned is if this number (or the 1-3+ years number) is much higher than historical capex. In that case, the company might have huge future obligations that will weigh down on future free cash flow—catching investors by surprise especially if management doesn’t disclose these plans elsewhere.
In any case, we’ll track the flow of these Purchase Obligations for $APH to show the process of doing this investigative analysis by yourself.
Moving forward 1 year, to the 2019 10-k…
The Contractual Obligations table shows that Purchase obligations due in Less than 1 year are now at $384.9 million.
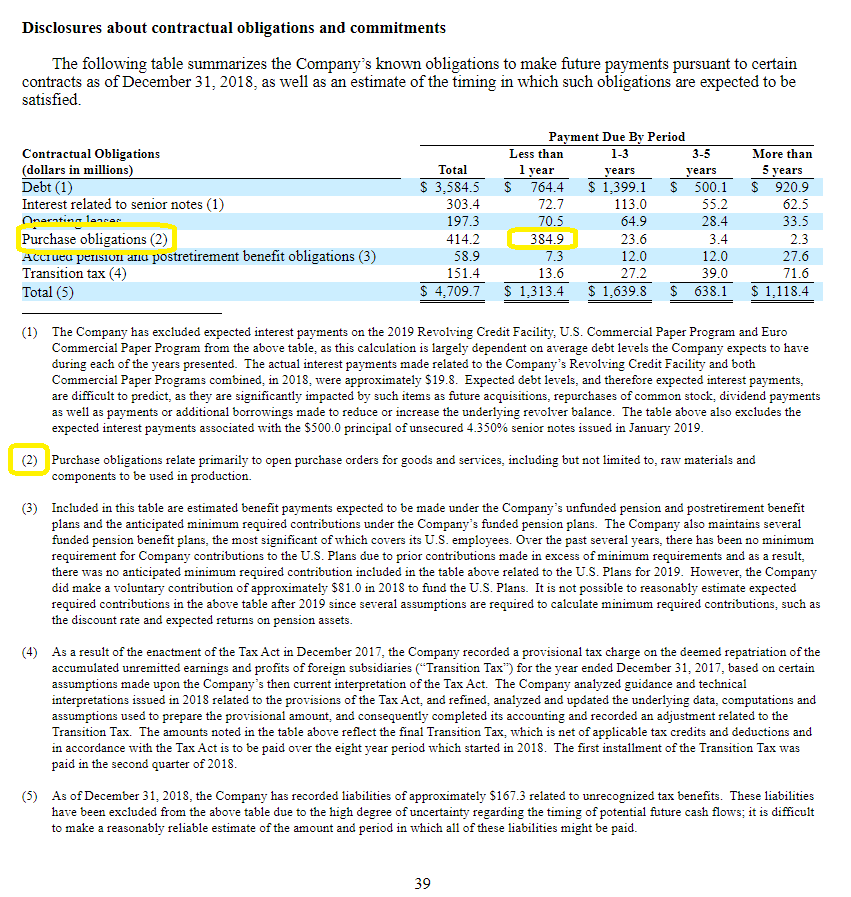
The Income Statement shows that Net sales for the company increased 16.9% for the year (from 2017 to 2018), while Capital Expenditures increased 37% to $310.6 million. But, even with the higher increase in capital expenditures, the ratio of capex to net sales was still 3.8% for 2018, which is in-line with management’s projections.
Go back to the Purchase obligations due in less than 1 year for the company in 2017, $286.9 million. The company’s total capex for 2018 was higher than what was planned for all POs due within 1 year ($310.6m vs $286.9m). This seems to indicate that the additional capex that the company made in 2018 was at their discretion from excess cash flow, not due to contractual capex that they had to fill.
Where investors can get the short end of the stick is when a management overcommits to future capex, and burns too much cash flow as those obligations come due. In this case of $APH, that doesn’t appear to be the case, since Purchase obligations are low compared to total Contractual Obligations and general capital expenditures.
Example: Company Seems to Have Heavy Drags on Future Cash Flow
Let’s take the opposite of the previous situation. Say a company has Purchase Obligations that are much higher than its historical capital expenditures.
It could indicate heavy drags on future cash flow, but not always. We’ll look at how to make a decent determination on that now.
Take the aluminum can supplier, also in the S&P 500, Ball Corporation ($BLL). From the company’s 2017 10-k which reports the 2016 Fiscal Year, we can see the following table under “Commitments”.
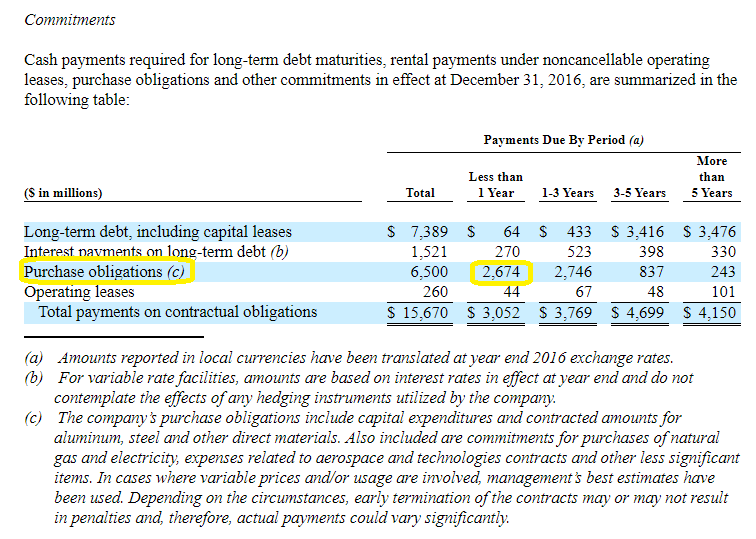
The company has $2,674 million in Purchase obligations due in Less than 1 Year, which is much higher than the last 3 years of Capital expenditures for the company ($606m, $528m, $391m).
We need to determine whether those POs are mostly raw materials purchases and other Cost of Goods (COGs) expenses, or if they represent huge future capital expenditures. Note that we don’t be able to know for sure, since the discrepancy isn’t GAAP required, but this exercise helps us understand the business model (and probable future cash flows).
What I decided to do was to collect the pertinent financial information as it related to these Purchase Obligations for $BLL, to try and determine what percentage of these POs that Ball Corp usually uses as Cost of Goods (Cost of Sales in their case) in order to create profits.
Note that for the column “POs”, I took that figure from the Contractual Obligations table for each year, with whatever number they recorded for Purchase obligations in the column titled “Due in less than 1 year”. The table:
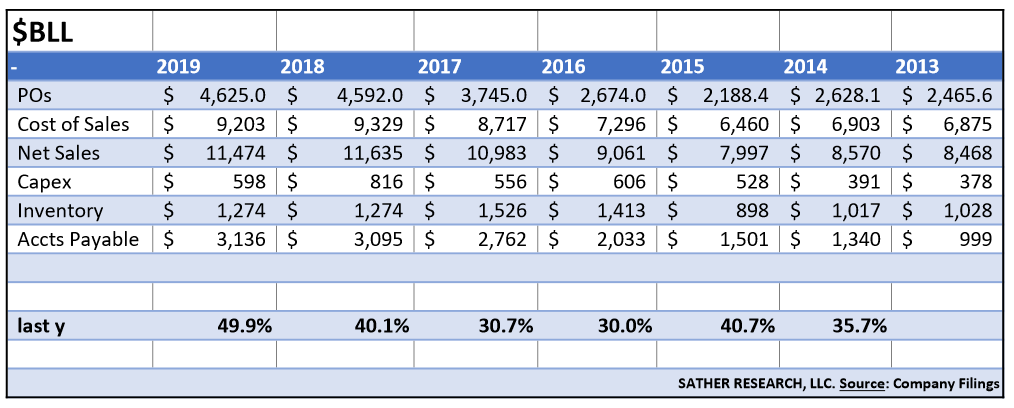
The “last y” row at the bottom of my table is a calculation to measure how management anticipates future Cost of Sales and how much of those POs actually encompass Cost of Sales.
For example, “last y” for 2019 is 2018’s PO ($4,592m) divided by 2019’s Cost of Sales ($9,203).
In this case, we can see that Ball Corporation tends to make POs in the ballpark of 30%-40% of next year’s Cost of Sales, as that was their normal range from 2014-2018.
However, notice the sharp uptick in 2019, all the way up to 49.9%.
This can mean:
- The company overestimate future Cost of Sales
- The company spent heavily on Capital Expenditures (2019)
Since we’ve seen 2019’s results, we can see with hindsight that the company seems to have anticipated much more demand than it actually got. Capex was actually normal near $600m, and so this lower cost of sales for 2019 explained why their POs turned out to be more aggressive than normal.
Noticing that inventory didn’t dramatically rise from 2018 to 2019, it seems that the higher than normal short term POs were absorbed in the company’s Cost of Sales, which makes sense because Cost of Sales at $9,203 million is much higher than their POs are. This makes sense logically too, since Off-Balance Sheet purchase obligations don’t necessarily capture all of the POs needed to run a business from year to year, and many can be executed in the short term and never appear as a Contractual Obligation.
It does make sense to make sure there were no major inventory write-downs as a result of the higher PO activity from $BLL, which I’ll show how to do quickly here.
Evaluating for Inventory Write-downs
This lesson will work as a two-part to understanding the changes on working capital in the Cash Flow Statement as it relates to inventories, and to check if a company’s aggressive PO policy has resulted or is likely to result in future inventory write-downs.
From $BLL’s 2020 10-k reporting on fiscal year 2019, I did a “ctrl+f” search for “inventor” to see instances of “inventory” and “inventories” in the document. I found the following disclosures:
- Beverage Packaging, South America
- The company recorded charges of $29 million in 2019 related to asset impairments, accelerated depreciation and inventory impairments related to plant closures and restructuring activities.
- Beverage Packaging, Europe
- During 2019, the company recorded charges of $26 million for asset impairments, accelerated depreciation and inventory impairments related to previously announced plant closures and restructuring activities.
- Changes in Inventory explained by the following:
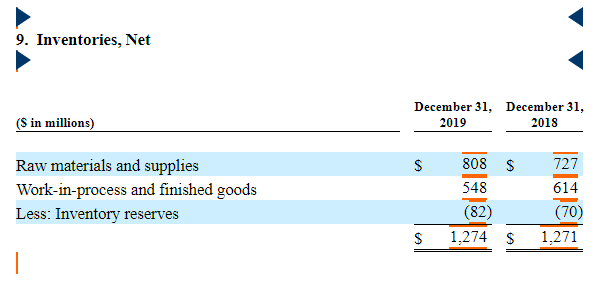
Looking at the cash flow statement, we see the change in working capital involving Inventory to be -$45 million:
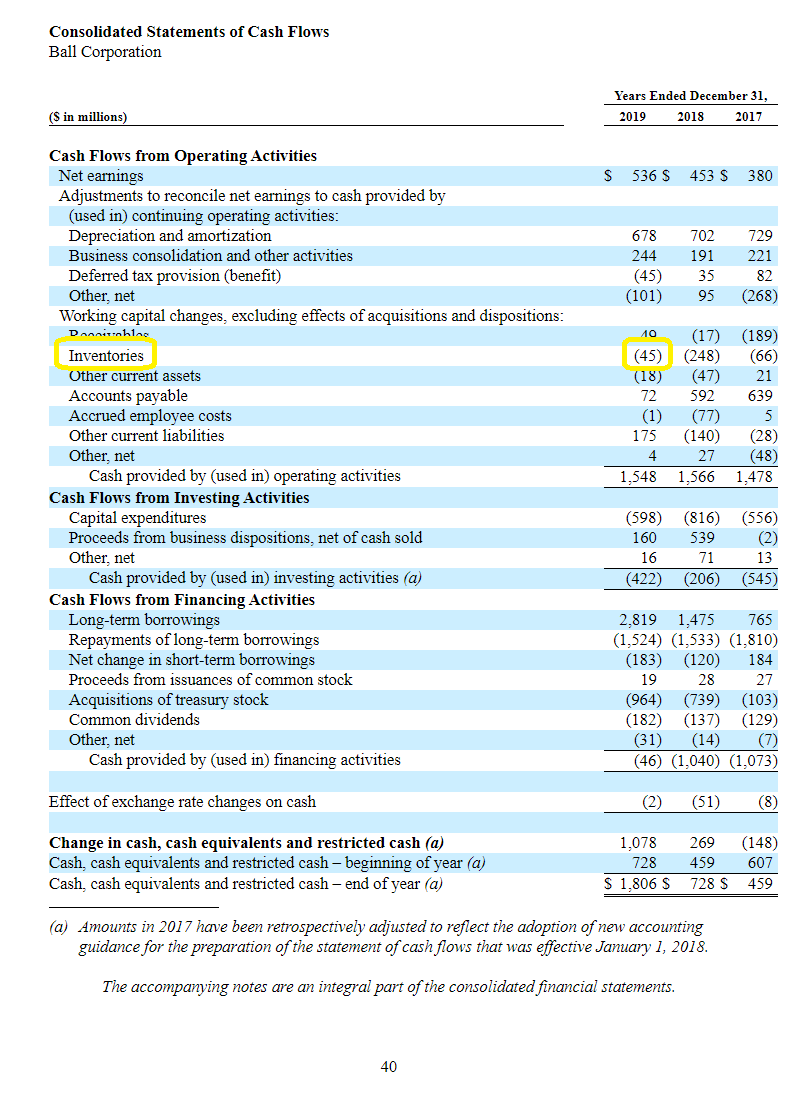
Notice that the change in working capital for $BLL’s inventory is not simply 2019 inventory ($1,274m) minus 2018 inventory ($1,271m). Rather, the impacts of write-downs and other special calculations (like reserves) need to be included to estimate how the true working capital (or cash flow situation) changed from one year to the next.
Since we’ve done our homework, we know that the impairments total -$55 million, with changes in reserves and total inventory making up the difference to get the change in working capital for inventory at -$45 million.
Knowing this compared to the backdrop of Ball Corp’s potentially high POs discussed above, we can see that inventory write-down was not a problem of what seemed like an over-estimation of demand for 2019.
However, noticing that POs due in less than 1 year for Fiscal Year 2019 are still at basically the same level than what the company did in 2018, we can watch for any possible overshoots which would lead to wasted capital. But if 2019 was any indication, it seems like inventory isn’t a problem for Ball Corp and that they simply need to make large POs in advance as a part of their business model.
Investor Takeaway
None of this analysis is meant as a “fix-all” for analyzing a business and its future obligations and cash flows—rather, it’s another tool under the belt.
Nothing replaces a complete circle of competence on an industry of the company you are evaluating, which can only be achieved by reading the 10-k’s of all competitors and building the picture from there.
Hopefully I’ve made that process a little easier for you today, and that you’re more informed about a critical section in company 10-k’s.
