Revenue is the most important factor in investing. And most investors focus on revenue growth and profits. But we should also consider the different revenue streams.
These different revenue streams drive growth and prospects.
Consider Amazon, who started as a bookseller. Now, they operate in many different markets and sectors, like cloud computing, e-commerce, and shipping, for example.
These have contributed mightily to their continued success.
In today’s post, we will learn:
- What are Revenue Streams?
- Different Types of Revenues
- Importance of the Analysis of Revenue Streams
- Real-Life Case Studies of Revenue Streams
- KPIs for the Analysis of Revenue Streams
Okay, let’s dive into the analysis of revenue streams of companies.
What are Revenue Streams?
Revenue streams are the lifeblood of any company, representing the various sources of income generated through its core operations.

They encompass different avenues through which a company earns money, such as product sales, service fees, licensing, subscriptions, and more.
Understanding revenue streams is vital in analyzing companies because they provide a comprehensive view of a firm’s financial health, performance, and sustainability.
One critical role of analyzing revenue streams is to assess the diversification and stability of a company’s income sources.
A company with multiple, well-balanced revenue streams is often better equipped to weather economic fluctuations and market changes. Diversification mitigates risks associated with dependency on a single source, ensuring the company can adapt to shifting consumer preferences and industry trends.
Additionally, revenue streams help investors and stakeholders gauge a company’s growth potential. Analyzing the growth rate and profitability of specific revenue streams can reveal where a company excels and where it might need improvement.
For instance, with rapidly expanding subscription-based revenue, Netflix may indicate a strong competitive position in its market.
Furthermore, revenue streams provide a window into a company’s business strategy and competitive advantages.
For example, Costco relies on high-margin, recurring subscription revenue, demonstrating its ability to secure customer loyalty and create sustainable income.
Different Types of Revenues
Revenues come in all different kinds of sizes and flavors. To understand a company fully, we need to have a handle on those different types.

Here are some key categories of revenues:
1. Product Sales: These revenues stem from selling physical goods. For instance, a smartphone manufacturer like Apple generates a significant portion of its revenues from iPhone sales.
2. Service Fees: Companies offer services like streaming, consulting, or delivery and charge fees for these services. Netflix, a subscription-based streaming service, relies on service fees.
3. Subscription Models: These revenues arise from regular payments for access to a service, content, or product. An example is Amazon Prime, which provides various services, including streaming and expedited shipping.
4. Licensing and Royalties: Companies earn money by permitting others to use their intellectual property, like patents, trademarks, or copyrighted content, in exchange for royalties. Disney, with its iconic characters, earns revenue through licensing agreements.
5. Advertising: Businesses generate revenue by displaying advertisements on their platforms or in their content. Google, a search engine giant, makes substantial income from advertising.
6. Commissions: Some companies act as intermediaries, connecting buyers and sellers, and earn a commission on successful transactions. Online marketplaces like Amazon rely on this revenue source.
Understanding the mix of revenue sources is crucial for evaluating a company’s stability and growth potential.
The above list is far from comprehensive.
The business world remains diverse, and you can find revenue streams from commodities (oil) to biotechnology.
Diversifying revenue streams can reduce risk, while overreliance on a single source may pose challenges during market fluctuations.
Essentially, the array of revenue types and their composition provides insights into a company’s financial health and ability to adapt to changing market conditions.
Importance of the Analysis of Revenue Streams
Revenue streams hold immense significance for businesses as a fundamental factor shaping their financial health, growth, and sustainability.
Key idea: companies without revenue growth above the GDP in their economy don’t have much of a future.
Understanding the importance of revenue streams is essential for both companies and investors.
Revenue is a Key Performance Indicator (KPI) for All Businesses:
Revenue is a universally recognized Key Performance Indicator (KPI) for businesses.
It is a metric that reflects an organization’s financial performance and success. It tells you how much money a company makes from its core operations.
Companies and investors closely monitor revenue because it provides an immediate snapshot of a company’s sales, demand for its products or services, and ability to generate profits.
Revenue is not just about the amount of money coming in; it’s also about the stability and consistency of income. By analyzing revenue streams, investors can gauge the reliability of their income sources. A well-diversified revenue portfolio can indicate a healthier financial position, as it reduces dependence on a single income source.
Performance Prediction Differs Between Different Revenue Streams:
Not all revenue streams are created equal, and their behavior can vary significantly. Different revenue streams can have varying levels of profitability, growth rates, and associated risks.
Therefore, analyzing and understanding the performance of each revenue stream is crucial for accurate prediction.
For example, a company with a subscription-based revenue stream may exhibit stable and predictable income over time.
In contrast, a product-based revenue stream might experience fluctuations due to seasonality or market trends.
By dissecting and evaluating these streams separately, businesses can make informed decisions on resource allocation, investment, and risk management. Additionally, predicting the performance of individual revenue streams is essential for investors. It helps them assess the potential for growth and sustainability.
A company that relies on a single revenue stream may face greater risks, as disruptions in that stream can significantly impact its financial stability.
The risk of disruption continues to grow with the advent of AI and the growth of technology. It helps highlight the importance of finding companies with optionality.
Companies with optionality can continue to adapt to an ever-changing world.
Great examples include Amazon, Google, Microsoft, and many others.
Revenue streams play a pivotal role in the business world. They are not just numbers on a financial statement but indicators of a company’s financial strength and stability.
Understanding the nuances of each revenue stream allows for more accurate performance prediction and strategic decision-making, benefiting companies and investors alike.
When trying to predict revenues, remember, they are just predictions. We can’t know if our predictions will come to pass; they are just predictions.
Real-Life Case Studies of Revenue Streams
Understanding the real-world application of revenue streams is essential for grasping their significance.

Let’s delve into case studies of three iconic companies – Amazon, Apple, and Netflix – to see how they have diversified and leveraged their revenue streams.
Amazon: A Model of Diverse Revenue Streams
When it comes to diversifying revenue streams, Amazon stands out as a shining example. The e-commerce giant has multiple income sources that contribute to its financial success.
- E-commerce: Amazon’s primary revenue stream is its online marketplace, which sells many products. From electronics to clothing to groceries, Amazon has transformed how we shop. This e-commerce segment remains the cornerstone of the company’s revenue.
- In 2023, Amazon had $225.8 billion in online store revenues, growing at 14.6% CAGR. These revenues occupy over 40% of Amazon’s annual revenues.
- Amazon Web Services (AWS): Another significant revenue driver is AWS, Amazon’s cloud computing division. AWS offers businesses a wide range of cloud services worldwide, hosting websites, databases, and more. The demand for cloud computing services has surged in recent years, propelling AWS into a substantial income generator.
- Amazon generated $87.9 billion in revenue from AWS, a CAGR of 40.8% while becoming a bigger piece of the revenue pie.
- The importance of AWS to Amazon cannot be understated. The segment generates a large portion of the company’s profits plus cash flows. It also showcases Amazon’s ability to pivot and adapt.
- Subscription Services: Amazon Prime, a subscription service, provides members with a bundle of benefits, including free two-day shipping, streaming of movies and music, and exclusive deals. Subscriptions like Amazon Prime add to the diversity of Amazon’s income streams.
- Amazon’s subscription revenues continue to grow, reaching $38.1 billion at a 35% CAGR.
- The Prime subscription remains one of the greatest inventions for Amazon. It helps drive more adoption of the Amazon ecosystem while acting as a great gateway to Amazon.
Apple: A Master of Product-Centric Revenue Streams
Apple, renowned for its innovation and iconic products, primarily relies on revenue streams centered around its hardware and ecosystem.
- iPhone: The iPhone remains the crown jewel in Apple’s product portfolio. It consistently contributes the lion’s share of revenue. Each new iPhone release generates massive sales, and the product has a devoted global customer base.
- The iPhone generated over $199 billion in revenue in the last twelve months, over half of Apple’s total.
- Mac and iPad: Apple’s line of computers and tablets also significantly contribute to revenue generation. These products cater to personal and professional users, contributing to Apple’s diverse income streams.
- The Mac and iPad generated over $62.2 billion in revenue in the last twelve months.
- Services: In recent years, Apple has ventured into services like Apple Music, Apple TV+, and the App Store. These services provide a steady stream of recurring revenue, and the App Store, in particular, plays a pivotal role in connecting developers with consumers.
- The services segment or revenue stream has become a bigger focus of Apple. Services generated over $82 billion in revenue and have grown at 18.7% CAGR over the past ten years.
Netflix: The Subscription-Based Revenue Model
Unlike Amazon and Apple, Netflix’s primary revenue model is subscription-based. The company has revolutionized the way we consume entertainment content.
- Subscription-Based: Netflix offers streaming services for a monthly fee. Subscribers gain access to a vast library of movies, TV shows, documentaries, and original content. This subscription-based model has catapulted Netflix to the forefront of the streaming industry.
- Original Content: To further enhance its revenue streams, Netflix invests heavily in producing original content. Blockbuster series like “Stranger Things” and “The Crown” have attracted a global audience and contributed to the company’s sustained growth.
- Ad Revenues: Netflix has recently expanded to offering ads at different subscription tiers. The ad revenues are a new strategy for Netflix, and the company doesn’t break out the impacts yet.
These case studies show the diverse revenue strategies employed by Amazon, Apple, and Netflix.
Amazon’s ability to balance e-commerce, cloud services, and subscriptions exemplifies the benefits of diversification. Apple’s success is rooted in its iconic products, while its services segment bolsters recurring revenue. On the other hand, Netflix thrives on a subscription-based model that spans the globe.
These case studies highlight the importance of optionality. All three companies have created iconic products:
- iPhone
- Prime
- Streaming videos
But, they all have added revenue streams related to the core products or tangentially related.
These additions allow each company to continue growing and remain relevant.
Key takeaway: Look for companies with optionality or potential optionality. These companies have the potential to remain relevant for a longer period.
Remember, nothing lasts forever, even in the stock market. For example, the top ten companies in the S&P 500 20 years ago haven’t remained the same. Only Microsoft and Apple have stood the test of time.
KPIs for the Analysis of Revenue Streams
Key Performance Indicators (KPIs) serve as vital metrics that allow companies to evaluate and measure their financial performance.

Important KPIs for revenue include many of the usuals:
- Revenue growth
- Profitability, ie. Gross, Operating, and Net
But we have others we should look at if you want to dive deeper.
Three essential KPIs that provide valuable insights into revenue streams are:
- Unit economics
- Customer economics
- Store economics
Let’s explore these metrics through the lens of industry leaders like Netflix, Amazon, and Costco.
Unit Economics: The Netflix Subscription Model
Unit economics assesses the profitability of a single transaction, product, or service.
In the case of Netflix, the unit of measurement is its subscribers. Netflix’s unit economics examine the cost of acquiring and retaining subscribers compared to the revenue generated from each subscription. The company has mastered this balance, ensuring that the revenue from each subscriber exceeds the costs associated with content creation, marketing, and other operational expenses.
Netflix tracks paid memberships across different geographic regions and churns (how many people unsubscribe) and ARPU (average revenue per user).
These metrics help them understand how profitable each subscriber is to Netflix and how much it will cost them to add more.
If we want to analyze Netflix, we need to understand standard revenue numbers, but we also need to understand subscriber metrics. Otherwise, we have an incomplete picture. Plus, we want to look at other revenue streams as they come online. For example, how much will ad revenue or gaming move the needle?
Customer Economics: Amazon Prime Subscribers
Customer economics delves into each customer’s value to a company over the long term. Amazon’s Prime membership program is a prime example of this.
Over the past five years, Amazon has grown its Prime subscribers:
- 2023 – 161.7 million
- 2022 – 157.4 million
- 2021 – 151.9 million
- 2020 – 142.5 million
- 2019 – 124 million
By analyzing the revenue generated from each Prime subscriber, Amazon can assess the profitability of customer loyalty.
The annual Prime subscription fee, increased purchase frequency, and basket sizes contribute significantly to Amazon’s bottom line.
Amazon does not reveal any specific ARPU (Average Revenue Per User) stats for its Prime subscription service.
However, Amazon does provide some high-level stats about Prime that we can use to infer the ARPU. For example, Amazon has stated that it has over 200 million Prime members worldwide. Amazon has also stated that Prime members spend more money than non-Prime members.
Based on this information, we can estimate that the Amazon Prime ARPU is $100-$200 per year.
This is a very high ARPU compared to other subscription services, such as Netflix ($13.99 per month) and Spotify ($9.99 per month).
This KPI highlights the effectiveness of cultivating a loyal customer base and nurturing long-term relationships.
Store Economics: Costco and Store Count
For companies with physical locations, like Costco, store economics are paramount.
This KPI evaluates the financial performance of each store, considering factors such as revenue, operating costs, and profitability. By monitoring store economics, Costco can determine which stores are thriving and which may require adjustments in operations or investment.
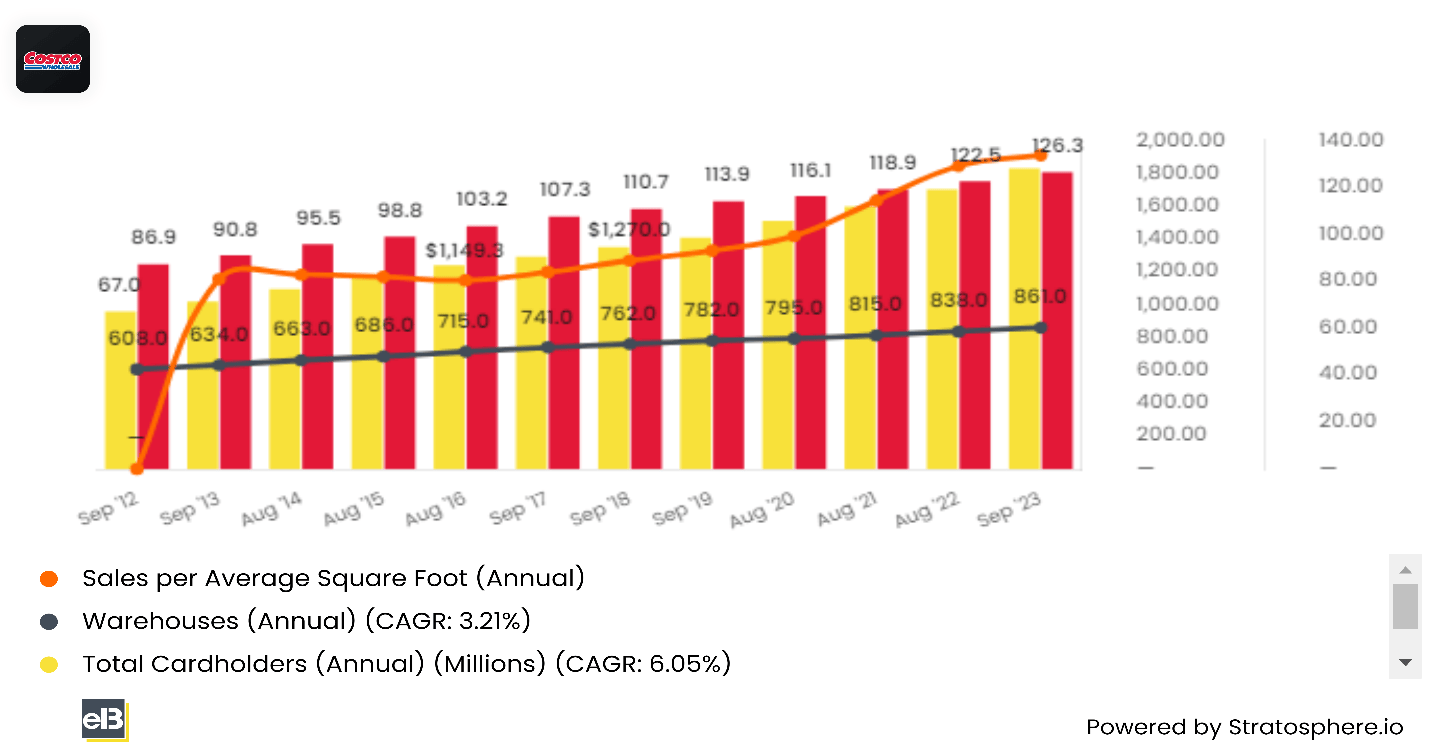
The total number of stores in the Costco portfolio reflects its growth strategy and capacity to serve its customer base efficiently.
Costco currently has 861 stores globally, measuring the square footage of their warehouses (126.3 million) and sales per average square footage ($1,910.9).
Understanding these KPIs, along with subscribers for Costco, is critical to fully understanding the business. These KPIs drive the company’s future growth and management decisions.
In essence, unit, customer, and store economics are vital KPIs that provide a granular view of how companies manage and leverage their revenue streams. They enable businesses to assess profitability at various levels, from individual transactions to long-term customer relationships and store performance.
Successful companies like Netflix, Amazon, and Costco use these KPIs to make strategic decisions, ensuring their revenue streams remain healthy, sustainable, and continually optimized.
Investor Takeaway
Analyzing revenue is paramount for businesses, investors, and stakeholders, as it is a vital barometer of financial health and success. While metrics like revenue growth and profitability are crucial, understanding different revenue streams and Key Performance Indicators (KPIs) amplifies the depth of this analysis.
Companies with diverse revenue streams are often better equipped to withstand economic fluctuations and market changes.
Analyzing the profitability of individual transactions or units helps companies optimize costs and revenues at a granular level. This KPI, exemplified by Netflix’s management of subscriber economics, enables businesses to make data-driven decisions.
Measuring the long-term value of customers, often exemplified by Amazon’s Prime subscribers, underscores the significance of cultivating loyal customer relationships.
Understanding customer economics helps companies gauge the effectiveness of their loyalty and retention strategies.
For businesses with physical locations, store economics are pivotal. KPIs in this category assess the performance of each store, guiding decisions on operational adjustments and growth strategies.
Companies like Costco closely monitor store economics to optimize their retail footprint.
By integrating these elements into revenue analysis, investors can comprehensively understand financial performance. It’s not just about revenue numbers; it’s about understanding the diverse sources of income and the KPIs that drive them.
Okay, with that, we will wrap up our discussion of the analysis of revenue streams.
Thank you for reading today’s post; if I can further assist, please don’t hesitate to reach out.
Until next time, take care and stay safe out there,
Dave
