The REIT Cap Rate formula, along with Funds From Operations (FFO), are two critical REIT ratios to understand and implement when analyzing REIT (Real Estate Investment Trust) stocks.
REITs require special ratios, of course, because of the unique features and structure of their business models.
In contrast to more traditional corporations, REITs derive their revenues primarily through real estate, with minimum requirements on real estate assets and revenue. Also special to REITs, the companies raise most of their capital from debt and shares issuance, rather than through free cash flows.
The effects of these features on REITs include:
- Much more debt on the balance sheet
- Higher dilution of shares from year to year
- ROIC and ROE ratios not very useful
- Free Cash Flow also not a useful metric
Analyzing the financial statements of REITs requires different measurements of future growth drivers due to the differences in how they finance growth. And because REITs are so heavily invested in real estate, their financials provide different indications of efficiency and value, because of the accounting of real estate assets.
That’s where the cap rate formula comes in, and becomes a more helpful guide at measuring management’s allocation of capital than a metric such as ROIC or ROE would for most other public corporations.
Real Estate Accounting: Depreciation
With current GAAP accounting standards, real estate assets are recorded at cost on the balance sheet. This value remains constant for as long as the company retains the asset.
This doesn’t match up with the reality of the value of that asset, however.
In the real (non-accounting) world, real estate tends to appreciate in value over the very long term. But because values of assets on a balance sheet remain constant, that appreciation is not baked into the balance sheet for a REIT unless the company sells the asset.
Contrast that to other long term assets which other companies must purchase and go on the balance sheet, such as Plant, Property, and Equipment (PPE). These tend to have “useful lives” and become worthless over time, while a piece of real estate may continue to appreciate indefinitely.
Whether a company is buying a long term asset such as real estate OR PPE, they must capitalize (depreciate) the asset over its useful life.
The reason for depreciation is to smooth out large investments so they don’t make earnings wildly fluctuate from year to year.
Instead of having a company charge huge expenses in any given year, they are smoothed out over multiple years as a (depreciation) charge on the income statement, lowering Net Income. What this is meant to do is account for the slow loss in value to the asset (in the balance sheet and in real life) over time.
But remember that real estate, in real life and on the balance sheet, does not (usually) lose value over time.
So for REITs, depreciation is less of an expense and more of an accounting requirement. It’s for that reason that you can’t use ROE, as a company’s Net Income doesn’t represent a REIT’s true cash flows as Net Income is being weighed down by a “not-real” depreciation expense. ROIC doesn’t provide much help either, since a REIT doesn’t have much in the way of working capital compared to other companies with inventory.
Instead of ROE or ROIC, an investor evaluating REIT allocation of capital needs to use cap rate.
Real Estate Accounting: Use Capitalization (Cap) Rate for REITs
The cap rate formula works to better estimate a REIT’s cash flow from its real estate investments. We’re trying to figure out the historical ROI from each property that the REIT has earned with this formula.
Cap rate is very similar to an ROI or earnings yield formula. The higher the cap rate, the better. It is the more return a REIT is receiving from its investments (in the form of rents).
Calculating the cap rate formula for REITs is very simple:
Cap rate = (Net Operating Income) / (Current Market Value)
Net Operating Income, or NOI, is the cash flow received from a property in the form of rent, after adjusting for expenses.
Current market value is value of the property itself. While property values tend to rise over time, so do rents. And so, although rising real estate prices would lower the cap rate by driving up current market value, rents should also rise in lock-step with the real estate market to at least maintain a good cap rate for the REIT.
Otherwise, management probably didn’t pick a good property with enough demand to support higher lease escalators, which does drive down long term return on its investments. (Or, they could’ve structured a poor lease agreement or otherwise had unfortunate developments).
What makes cap rate difficult to calculate on real-life REITs is that as we established before—real estate assets are marked at cost rather than updated at current market values.
So it may seem that calculating REIT cap rates can’t be done by the average investor.
Not true if we are smart about it.
How to Calculate REIT Cap Rates (10-k)
Since we have to rule out the idea of valuing old real estate assets acquired years ago and likely worth much more than purchased at cost, we have to look at the most recent purchase prices in order to get current market values of properties.
We can do this from a year-to-year perspective, and observe how the growth in real estate values on a balance sheet equate with year-over-year changes in NOI (Net Operating Income) in order to calculate a cap rate.
So, by adjusting the cap rate formula, we can calculate each year’s cap rate by the following:
Cap Rate (Current Year) = (Current Year NOI – Last Year NOI) / (Current Year Real Estate Asset Value – Last Year Real Estate Asset Value)
Note that NOI is not a GAAP metric, so we won’t see it on a company’s consolidated financial statements. However, this should be a metric that every REIT will disclose somewhere in their 10-k, and will be integral for calculating cap rate for each REIT.
Also, and this is very key, we have to make sure we are making appropriate adjustments to the Asset Values when it makes sense to do so.
For example, if a company just offloaded a significant chunk of its real estate portfolio which reduced its Total Asset Value of Real Estate, then the years affected should not be considered in the cap rate calculation.
Try to keep things apples-to-apples, and make sure that each year’s NOI and Asset Values are comparable in order to keep away the negative effects of one-time changes.
Example: $STOR
For this first example we are going to use my favorite current REIT, STORE Capital (ticker: STOR). From the company’s latest 10-k, we find these facts (on 2020 revenue, by industry):
- 64% = Service
- 18% = Retail
- 18% = Manufacturing
STOR caters mostly to middle-market businesses who usually don’t have access to large financing vehicles such as the bond market, due to being just a little too small to be rated as investment grade by bond rating agencies like Moody’s.
The transaction between STOR and a middle market business is mutually beneficial because STOR’s access to capital, due to being such a large REIT, provides additional flexibility and a lower cost, which it can pass down to its tenants.
From there, STOR will make a profit on the spread—the difference between its cost of capital and the lower rents it is able to provide to tenants.
It is that attractive rent to tenants that forms the NOI for STOR, and the price they pay for these real estate assets determines the market value which will calculate the cap rate, which eventually demonstrates the company’s return on capital deployed.
Important: Calculating NOI for a REIT can be complex and unique depending on the REIT examined and how they are presenting their figures in the 10-k. This is because it is a non-GAAP metric. I highly recommend you are comparing apples-to-apples as much as possible as you are estimating cap rates and NOI’s among REIT peers. See this article for a good example of some of the factors which influence NOI estimation.
Let’s now reference the latest 10-k to calculate the 2020 cap rate for STOR. First we are going to use a simplified Cash from Operations (in the cash flow statement) for NOI:
- 2020 NOI = $431,586 thousand
- 2019 NOI = $458,334 thousand
- 2020 Asset Value (Real Estate) = $7,988,709 thousand
- 2019 Asset Value (Real Estate) = $7,508,276 thousand
2020 Cap Rate = (431,586 – 458,334) / (7,988,709 – 7,508,276) = -5.6%
Let’s calculate that out a few more years for STOR to see how this compares to historical performance (particularly considering that 2020 was a strange year).
- 2019 Cap Rate = 7.9%
- 2018 Cap Rate = 7.1%
- 2017 Cap Rate = 6.6%
- 2016 Cap Rate = 6.1%
We see an increasing cap rate outside of the 2020 anomaly, which seems to indicate that STOR is on a good trend with its real estate acquisitions.
You can compare a REIT’s cap rate with its growth rate (such as Earnings Per Share or FFO per share), in order to see if a company is maintaining a good balance of growth and prudent ROI.
For a final sanity check, let’s compare STOR’s cap rate with another competitor’s to see if the company truly has better underwriting/ property selection than some peers.
A company called Agree Realty (ticker: ADC) also boasts a similar competitive strategy as STOR (the triple-net lease model, where the tenant pays for operational costs instead of the landlord). Here’s the cap rate calculations for ADC over the past 5 years (again using CFFO for NOI):
- 2020 Cap Rate = 1.5%
- 2019 Cap Rate = 6.0%
- 2018 Cap Rate = 2.5%
- 2017 Cap Rate = 7.8%
- 2016 Cap Rate = 6.8%
For ADC, they also didn’t disclose NOI specifically, so I used Cash Flow From Operations for NOI as a proxy (and not FFO, see below).
We can see ADC’s cap rate appears to be more lumpy, which could indicate higher turnover among its tenants and/or a few too many acquisitions that ended up bringing less income than anticipated. Or, the company could be sacrificing cap rate in order to chase higher revenue growth. But, ADC’s cap rate appeared to be very strong in 2017 and 2016, and perhaps the last 3 years were just a temporary setback.
In reality, it could be a multiple of things, but at least knowing how the cap rate for this REIT has been trending can give us a good starting point for figuring out a company’s true competitive advantages outside of just pretty words in the 10-k.
Notes about FFO vs NOI
These two special metrics for REITs are very similar because they add back depreciation, which remember we established as a non-real, non-cash expense.
However, FFO is different from NOI because FFO includes interest expense and income tax expense, which represent the real costs of a company to fund its real estate acquisitions. In the case of NOI, these net income specific expenses are excluded, in order to give a “more pure” look at the actual profitability of the property (properties).
So in other words, on an acquisition-by-acquisition basis, you want to look at NOI and its relation to market value in order to come up with a cap rate.
But when it comes to estimating the free cash flow of a company, you’ll want to use FFO, since debt is a real expense and those REITs who are able to borrow at lower costs of capital will have an inherently greater competitive advantage and more cash free to return to shareholders in the form of a dividend.
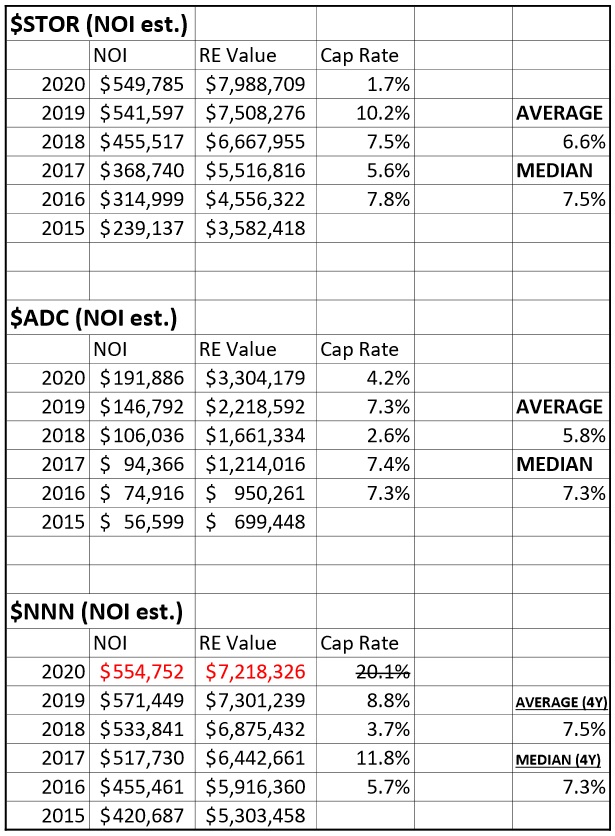
Better NOI Estimates: STOR, ADC, NNN
As you’ll recall above, estimating NOI can be difficult because it is a non-GAAP measure and each company presents its income statement figures slightly differently.
I wanted a more “true” cap rate estimation for STOR and ADC, so I took an NOI calculation from the Income Statement instead of blindly following the cash flow statement (since CFFO includes changes in working capital and other non-rent related charges/ benefits).
For STOR, I estimated NOI by using the following metrics from their income statement (NOI = Rental revenues minus Property costs, General and administrative, and Provisions for impairment). For ADC, again their income statement is slightly different but I could achieve a similar calculation by taking Income from Operations and adding back Depreciation & Amortization (i.e. NOI = Income from Operations + Depreciation and amortization).
Finally, I took a third competitor National Retail Properties (ticker: NNN) who is also a triple-net REIT peer, and calculated NOI based on the income statement in this way (NOI = Rental income minus General and administrative, Real estate, Leasing transaction costs, and Impairment losses).
Here’s how the cap rates ended up for each of the 3 companies:
Investor Takeaway
You can see that there’s more nuance to evaluating a REIT and its cap rate, but it isn’t impossible. Due to the peculiar rules on accounting for real estate, we have to make intelligent adjustments to financial metrics in order to determine how much cash flow a REIT generates as well as how efficient they are with their acquisitions.
We have many other blog posts about the specifics of evaluating REITs, which I highly recommend you read in addition to this one.
As real estate tends to be less correlated to the stock and bond markets, a healthy allocation into REITs could make the difference in performance during times of market troughs. But of course, you have to also pick the right REITs, and hopefully the resources we provide on this website will help you do just that.
