Updated 3/6/2024
Did you know that the financial industry makes up $8.81 trillion of the stock market cap, which is 13% of the market and is the third-largest by market cap compared to tech and consumer discretionary? Most investors ignore or pass the financial industry by because they don’t understand the industry or value those companies.
Using DCFs or discounted cash flow models is the tried-and-true method for most industries, but financials, including banks, insurance companies, and investment banks, are a different breed. Because of their capital structure, it is difficult to measure debt and reinvestment, making estimating cash flows a problem.
The regulatory situation and oversight over the financial sector, along with the challenging capital structure—rightfully so—after the financial crisis of 2007-2009—all need consideration when valuing these companies.
In today’s post, we will learn:
- Why Is Valuing Banks Difficult?
- Usual Methods to Value Banks
- Breaking Down a Free Cash Flow to Equity Model for Bank Valuation
- Real-life example of DCF Valuation of a Bank
Okay, let’s break down using a DCF for bank valuation.
Why is Valuing Financial Companies Difficult?
Financials such as banks, insurance companies, and investment firms are no different from “normal” companies attempting to be as profitable as possible. They also have to worry about competition and must grow continually.
If any of these companies are publicly traded, they face the same scrutiny that the other companies face for their total return to shareholders.
When discussing capital for non-financials, most discussions center around debt and equity, which are the building blocks for stimulating growth. A non-financial raises money from equity investors and bondholders and uses those funds to grow its assets for long-term growth.
When we value non-financial companies such as Walmart, we value the company’s assets instead of only the equity.
Debt in Financials
Debt, an ugly word if a company carries more than it can afford, has a different connotation in financial services.
As with most non-financials, these companies consider debt to be raw material instead of a source of capital. Debt to a bank is like inventory to Walmart; the financial department can mold it into a product they can sell to yield a profit.
Therefore, we can define capital in financials as equity capital, further reinforced by regulatory oversight focusing on the equity capital ratios of banks and insurance companies.
Let’s consider the debt situation of a bank or insurance company for a moment. According to the balance sheet of Bank of America, deposits from customers into their checking or savings accounts are debt. But should they be? And what about the interest-bearing accounts, especially considering that most banks’ primary income is on interest after paying interest on customers’ deposit accounts?
Instead of debt, most financials consider deposits or premiums as raw material to generate more income. For example, a bank will take your $100 deposit in your savings account and lend it to another customer to earn interest on that loan. So, the bank will generate income from the difference between the interest they collect from the loan and the interest they pay on the savings account.
The Regulations on Financials
The next issue is the regulatory nature of financials. Most financials are heavily regulated, and they take three main forms:
- Banks and insurance companies must carry capital ratios that ensure they don’t expand beyond their means
- Banks and insurance companies face restrictions on where to invest their capital.
- Restrictions on mergers and acquisitions
Because of these restrictions, we need to rethink how financials reinvest. For example, with non-financials, most reinvestments focus on net capital expenditures and working capital. However, these types of reinvestment are not available for financials.
Instead of working capital in the usual sense, banks focus on intangible investments such as brand or human capital, which are included in operating expenses.
Instead, we need to focus on regulatory capital as the main source of reinvestment. If you are not familiar with the regulatory capital of banks, I recommend you read the following post before continuing with the article:
Tier 1 Capital – The Easy Way to See the Strength of a Bank’s Balance Sheet
Now that we understand different aspects of valuing banks let’s examine a few of the usual methods.
Usual Methods to Value Banks
To value the equity of a company, the normal method is:
|
Free Cash Flow to Equity = |
|
Net Income |
|
|
|
However, because of the nature of the financials we discussed earlier, that cash flow calculation is far too difficult. Instead, we have three options:

- Treat dividends as cash flows to equity and assume that over time, companies will pay out their cash flows to equity as dividends.
- Focus on excess returns instead of earnings, dividends, and growth rates and value those returns.
- We will adjust our free cash flow to the equity calculations to allow for the regulatory-allowed type of reinvestment via the regulatory capital from Tier 1 ratios.
Dividend Discount Model
In the basic model, the value of the company is the expected dividends for the company. To get a better sense of how this model works, check out the below video:
Excess Return Model
In the excess return model, we write the financial value as the sum of capital invested now compared to the present value of excess returns the company expects to make.
To learn more about this model, check out the link below:
How To: Excess Return Model for Valuing Financial Stocks
Relative Valuation
We use relative metrics such as price to earnings (P/E) and price to book (P/B) to measure value in this type of valuation. Relative valuation is the most common form of valuation by analysts because it is quick and easy, but this method has pros and cons. To learn more, check out the article below:
Relative Valuation – Pros and Cons of the MOST Common Form of Valuation
To get a sense of these types of valuations in action, check out the article below, which includes all three valuation methods:
Charles Schwab – A Case Study in Valuation Methods
Breaking Down the Steps to Use a DCF for Bank Valuation
To value financial companies using the free cash flow to equity formula, a variation of the DCF, we will value the equity after debt payments and reinvestment needs are met.
As mentioned above, the reinvestment will come in regulatory capital instead of working capital or net capital expenditures.
The new formula for our free cash to equity formula will be:
|
Free Cash Flow to Equity = |
|
Net Income |
|
To define the estimations of regulatory capital, we have two parameters to consider:
- Tier 1 Capital ratio – the regulatory requirements for each bank heavily influence this ratio but will also reflect each financial decision on how to treat their capital. For example, a bank with a 5% Tier 1 capital ratio can make $100 in loans on each $5 in equity capital. When it reports a net income of $15 million but only pays out $5 million, it increases its equity capital by $10 million. That, in turn, allows the bank to loan out $200 in the next period and hopefully grow its equity.
- Profitability from operations—The financial company’s net income tells us how profitable the company is compared to its operations. Like a bank, net income grows with growing loan volumes, so a 0.5% profitability translates to an additional net income of $1 million from additional loans.
Steps to estimate reinvestment of regulatory capital
- Estimate growth rates in risk-adjusted assets over time
- Estimate expected tier 1 capital ratio year by year
- Calculate Tier 1 by multiplying Tier 1 ratios by risk-adjusted assets each year.
Example of Reinvestments: Bank of America
Okay, let’s start to work through each step for our reinvestments.
To value Bank of America, we will estimate its risk-weighted assets, Tier 1 capital ratio, and net income over the next ten years.
The risk-weighted assets are the total assets the bank owns, adjusted to the risk of the bank’s exposure to potential losses. These numbers can be found in the bank’s financials; our friend CTRL-F is the easiest way to find them.
Here is a screenshot from the latest 10-k, dated 2-24-21.
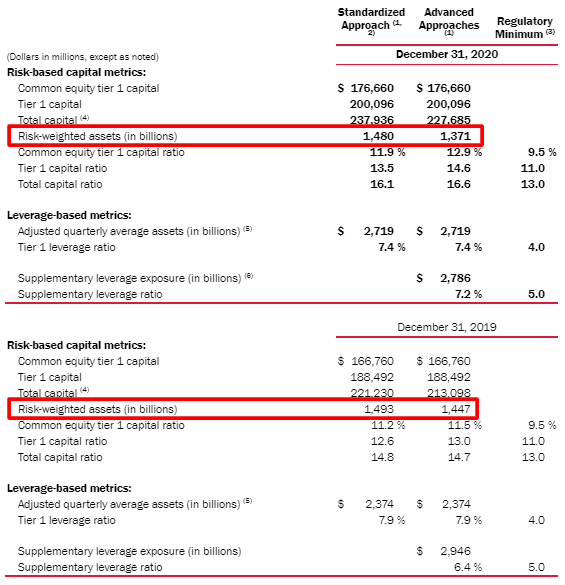
Next, we need the Tier 1 Capital for Bank of America, which is in the same chart, and I will do a similar screenshot:
The last number we need is the shareholders’ equity, which we can gather from the balance sheet. For Bank of America’s 10-k, it was $272,924 million.
Now that we have all the numbers, we need to start estimating the growth of Tier 1 capital and the change in regulatory capital, which is our reinvestment rate for our DCF.
Before we start the calculations, we need to estimate the growth in our Tier 1 capital, and the easiest way to do that is to look at historical growth. To that end, I took the risk-weighted assets from 2015 and used a CAGR calculator to compare the growth from 2015 to 2020 of $1.480 billion. This gives us a growth rate of 1.26%, so for giggles, let’s boost that to 2%.
To adjust the growth of the Tier 1 equity ratio, we looked at the FRED data, which gives us a banking industry average of 15.7%. Compared to Bank of America’s current level of 13.5%, we will assume it will move towards that average over the DCF.
Now that we have some growth rates for the risk-weighted average and Tier 1 equity ratio, we can calculate the change in Tier 1 capital.
Here is a snapshot for one year.
We can see from the above that the risk-weighted assets grew by 2%, giving us a change in Tier 1 capital, which we then subtract from the previous year’s Tier 1 capital, the bank’s reinvestment. We then add that reinvestment to the previous year’s book equity to get our new book equity. Finally, we multiply the new book equity by the Return on Equity, giving us our net income.
To calculate the free cash flow to equity, we subtract our change in regulatory capital from the net income, giving us the free cash flow to the equity.
Now that we have our free cash flow to the equity, we can next work out the discount rate to discount those free cash flows to equity back to the present.
Because we value equity, we will use the CAPM model to calculate our equity cost. The components of the model are:
- Risk-free rate = 1.27% (10-year Treasury rate, available at treasury.gov)
- Equity risk premium = 4.31% (Current rate available at Damodaran.com)
- Beta = 1.39 (current rate available at seekingalpha.com)
Plugging them into the CAPM formula of:
Cost of Equity = Risk-free rate + Beta * Equity risk premium
Cost of equity = 1.27% + 1.39 * 4.31% = 7.26%
All discounted cash flow models will take the present value of cash flows, add them up, and calculate a terminal value using the cost of equity and the terminal rate, which is the final value of growth of the risk-weighted assets.
As with any DCF model, we need to ensure the terminal value is less than the GDP of the bank’s economy.
And the model gives us the value of Bank of America based on our inputs.
As of the writing of this article, the current market price of Bank of America is $40.79 as of 8-17-2021.
Real-Life Examples of DCFs for Bank Valuation
Let’s try the model on a few financials to understand how this works. I will look up the financials, give you the model’s inputs, and show you the final results after the calculations.
JP Morgan (JPM)
|
$1,506,609 million | |
|
Growth rate of RWA |
2.31% |
|
Tier 1 Capital |
$205,078 million |
|
Net Income |
$29,131 million |
|
Book Value of Equity |
$249,291 million |
|
Shares Outstanding |
3049.4 million |
|
Beta |
1.27 |
|
Current Market price |
$155.58 |
After plugging in all of the above variables, we get a value of:
For our last example, let’s try a non-bank Morgan Stanley (MS), currently trading for $101.26.
|
Risk-weighted assets |
$453,106 million |
|
Tier 1 Capital |
$88,079 million |
|
Growth Rate of RWA |
3.23% |
|
Net Income |
$10,500 million |
|
Book Value of Equity |
$101,781 million |
|
Shares outstanding |
1,603 million |
|
Beta |
1.43 |
After plugging in the variables to the model, we get a value of:
I will include the model I created to write this post because it will help you play with the numbers to find the intrinsic value of any financial you wish to value.
Investor Takeaway
The price we pay matters a lot, and finding the intrinsic value of any company using the fundamentals is a great place to start any analysis. But, calculating a value is the starting place because we need to understand what drives those value variables. Once we understand those variables and the growth drivers, our valuations will make sense or seem wrong.
Analyzing banks, insurance companies, or investment banks is no different than any other non-financial. The biggest hurdle is understanding the different accounting languages for those companies and the drivers of growth. Once you understand those ideas and concepts, it is a matter of digging into the rabbit hole and finding the answers.
Don’t let the fear of the unknown stop you from analyzing or investing in the finance sector. There are a ton of great companies that will help you grow your wealth. Remember that the market composition is almost 20% of the financials, and that seems like a big opportunity to pass.
I hope this article helps you evaluate banks and other resources to do more due diligence on the financial sector.
And with that, we will wrap up our discussion for today.
As always, thank you for taking the time to read today’s post, and I hope you find something of value in your investing journey. If I can further assist, please don’t hesitate to reach out.
Until next time, take care and be safe out there,
Dave

Dave Ahern
Dave, a self-taught investor, empowers investors to start investing by demystifying the stock market.
