Updated: 4/06/23
This easy-to-follow beginner’s guide will help you learn how to invest in the stock market. We’ll be leaving out all the confusing Wall Street jargon and explaining things in simple terms.

In this post, we will cover the 7 following categories for understanding the stock market:
1. Stock Market Basics: Why to Invest
2. Understanding How the Stock Market Works
3. Learning How to Invest in Stocks
4. Learn About Stocks With the P/E Ratio
5. Two Stock Market Factors To Trade On: P/B and P/S Ratios
6. Finding the Best Stocks for Beginners: Looking for Dividends and Growth
7. The Best Way to Avoid Risk and Putting it all Together!
1– Stock Market Basics: Why to Invest
Let the power of compound interest do the work for you. This is how you unlock the magic of the stock market and slowly build wealth over time.
It’s not some mystified secret or get rich quick shortcut. This is a time tested method to become wealthy and be financially independent. It’s how billionaires like Warren Buffett have done it all their life.
Understanding investing means understanding compound interest, because that will be the key to your success with investing.
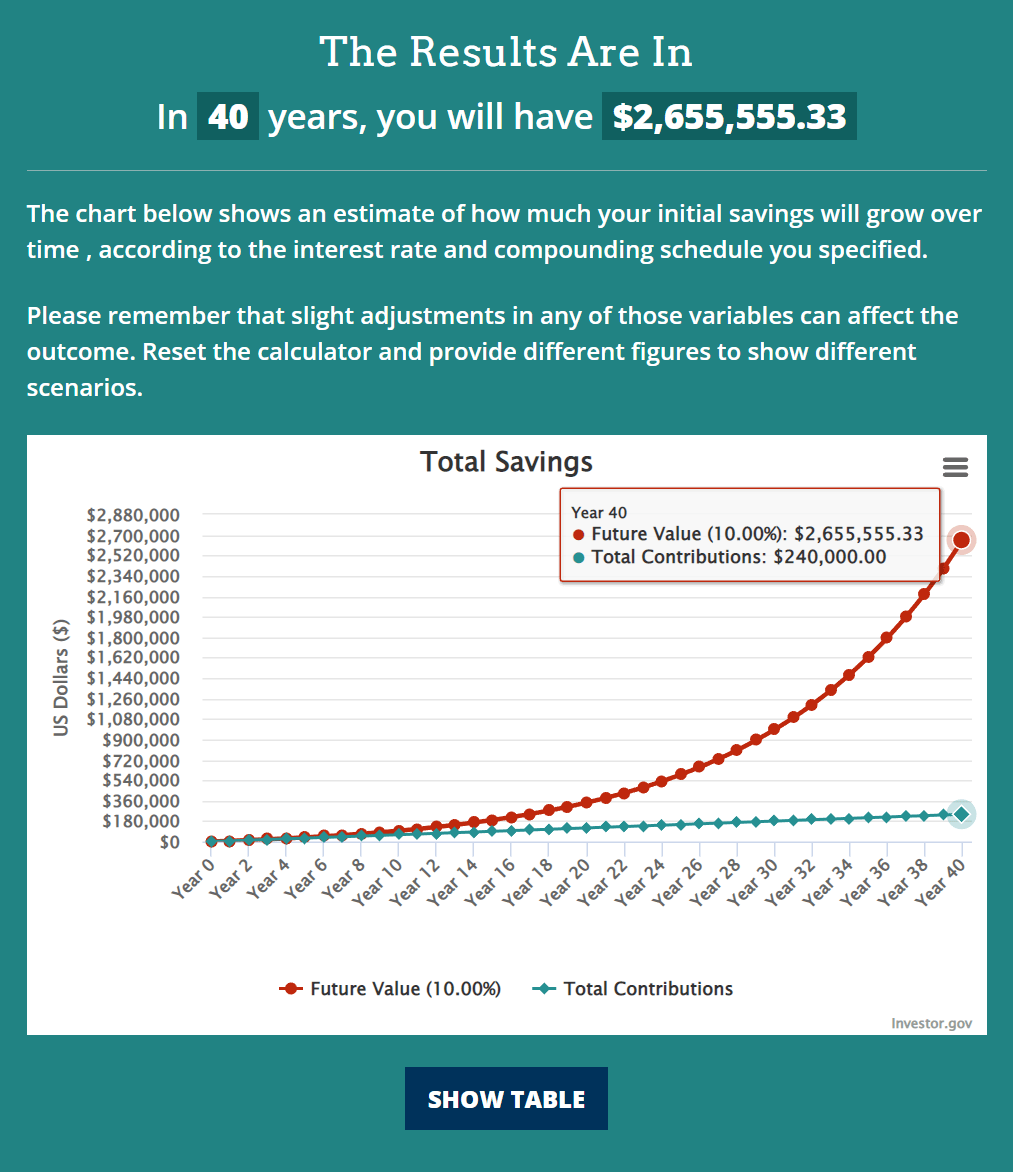
Let’s say you saved $500 a month for 40 years. This would leave you with $240,000 to live on, which on a $60k/year lifestyle would last just about 4 years. You’d retire at 65 only to go broke at 69, and you’ve been a good saver all your life.
Now add investing in the stock market instead.
Again, let’s say you saved $500 a month for 40 years. BUT, you invested it into the stock market and got just average stock market returns. The same $500 a month compounded annually at 10% turns your net worth into $2,655,555 in 40 years!
This is because, over the last 100 years, the average annual return for the stock market has been about 10% per year. If you buy and hold stocks for the long term, you can easily earn at least this 10% per year average.
2– Understanding How the Stock Market Works
Before I started researching investing, the only things I knew about the stock market were what I saw on the news or heard on TV. It was never positive.
All you need to know:
A share of stock represents part-ownership of a business. When you own a share of stock, you get a claim to part of the profits of a business because of that part-ownership stake.
The stock market is simply a place where ownership stakes of real-life businesses are traded, where you can buy or sell shares of stocks.
By investing in the stock market over the long term, you can participate in the growth of the economy over the long term. This is because the stock market contains some of the biggest businesses in the economy.

The simple idea:
If you think people will continue to innovate and the economy will continue to grow, then your stocks will also grow.
That said, there’s more to understanding how the stock market works. You have to beware of its very real dangers because it’s easy to lose if you don’t learn to invest in the market the right way.
Warning for Beginners: The Market Moves Up and Down A LOT
The market will have years with big gains or crashes in the short term.
Take a look at the market during the pandemic to see just how hard and fast the market can crash:
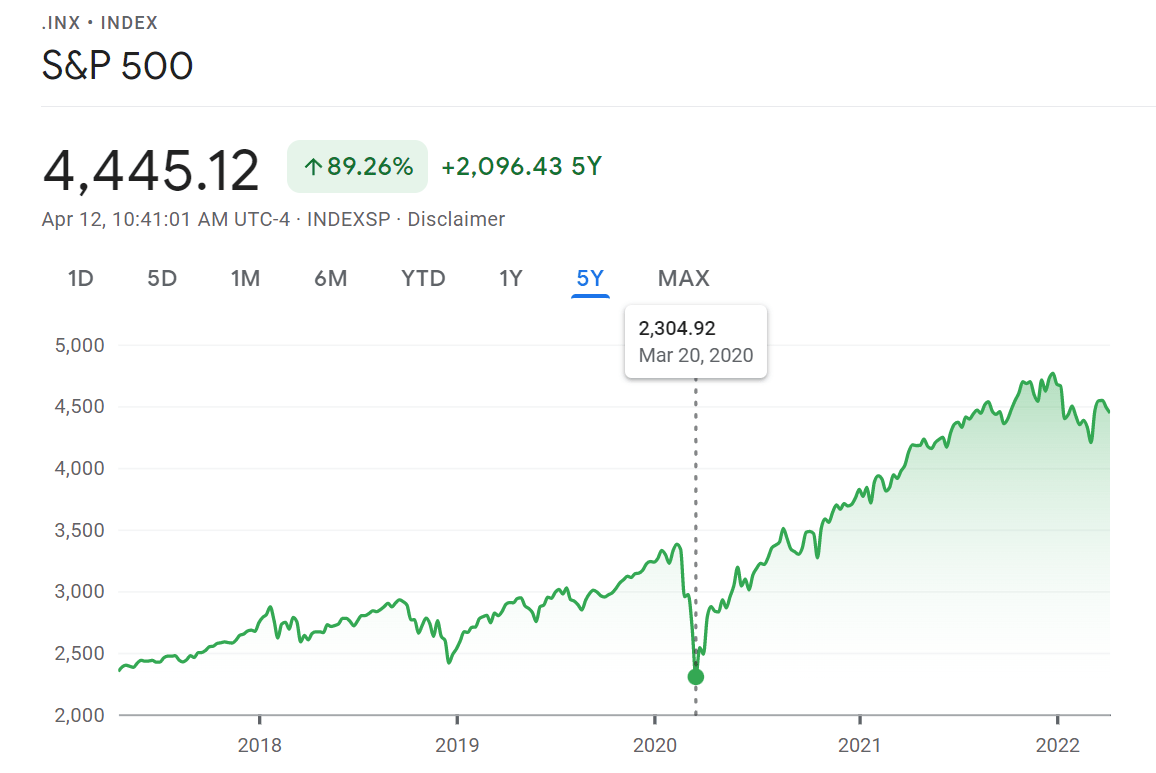
Yes, stock prices are volatile. They fluctuate up and down, sometimes wildly. But when held over long periods of time, the chances of gains from investing in stocks are almost guaranteed.
Smart Investors Don’t Listen to Noise
Please don’t forget that stocks are meant to be a long-term investment.
It will pay you dividends that, over time, will compound and multiply. And if invested in a good company, the share price should rise substantially as well.
As financial guru Dave Ramsey simply puts it, “The only people who get hurt riding a roller coaster are the ones that jump off.”
3– Learning How to Invest in Stocks
Buying just one share of your favorite company when buying your first stock is like taking your first step into the market.
I can’t stress enough how important buying your first stock is. You can read and read until your eyes turn blue, but you won’t start to see progress toward your results until you take action.
Trust me, from a guy who has been there before, buying your first stock gives you a sense of empowerment and excitement of being part of the stock market.
Time for Action: Buying Your First Stock
My next recommendation is to get your feet wet by buying your first stock.
First, you need to open an account with a broker. My podcast co-host, Dave Ahern, recommends Charles Schwab, and I like Fidelity and Merrill Edge.
You really can’t go wrong with any of those three — they all offer commission-free trades!

Whichever brokerage you decide to go with, make sure that the company is SIPC protected (which is different from FDIC on checking accounts). That could protect your assets during the next financial crisis.
These days, the process to sign up for a brokerage account is SO easy that there’s no excuse not to get started today. Let me go through some of the basic account types.
Individual brokerage account:
- Taxable, not used for retirement. Deposit as much as you want, withdraw whenever.
Traditional IRA:
- Contributions are pre-tax. Used for retirement, early withdrawals come with fees.
Roth IRA:
- You can only contribute with post-tax money, but are never taxed on capital gains or dividend income. Early withdrawals also have fees but with some exceptions.
Just Do It: Go Buy a Stock!
I always say that the key to investing is just getting started.
You could over-analyze the situation until your face gets blue, but you won’t make any progress until you open an account and actually buy at least 1 share. There’s nothing like having skin in the game, so think of a company you like, go buy its stock and see what it’s like.
You might be surprised how easy it really is.
4– Learn About Stocks With the P/E Ratio
The P/E, or Price to Earnings, ratio simply measures how much you are paying for a company’s earnings. The higher the ratio, the more expensive the company. A higher P/E ratio generally means a company is more popular and more people are buying this stock.
P/E ratios vary based on industry and market conditions. You can usually tell when the market is more expensive because the average P/E ratio in the market is high.
The average P/E ratio over time has been about 17.
But a company’s P/E can depend on other factors such as its growth, interest rates, and perceived risk or sustainability of earnings.
That all said, the P/E is one of the best shortcut tools for quickly measuring how expensive or cheap a stock is—how generally optimistic or pessimistic the market is on a stock.
To calculate P/E, you take a company’s market cap and divide by their earnings:
P/E = Price / Earnings
You have to do this either on a per-share basis or by company total. You have two options for this:
(Per share) P/E = Price per share / Earnings per share
(Total Company) P/E = Market Capitalization / Earnings
Knowing a company’s P/E helps us understand how much the market likes the stock.
5– Two Stock Market Factors To Trade On: P/B and P/S Ratios
These ratios can be more reliable indicators than P/E ratio because revenue (sales) and book value fluctuate much less than earnings do.
Earnings and Earnings Per Share (EPS) can be more easily manipulated by companies depending on accounting practices. There have been instances where companies were caught manipulating their earnings after the fact.
However, sales and book value are harder to manipulate– another reason these two ratios can be so useful.
The Price to Sales ratio is usually calculated on a total company basis, with the following formula:
P/S = Price to Sales
P/S = Market capitalization / Revenue
In general, a lower P/S is better especially if you are looking at high growth stocks. The historical average across the stock market has been around 1.55.
The P/B Buy Low Strategy
The basic premise behind buying stocks with low P/B ratios involves buying a company that is selling close to or below their book value. Therefore, the idea is you are buying a stock with very little downside because book value can represent a company’s “liquidation value”.
In other words, if a company were to close tomorrow and sell all of its assets at fair value, investors would expect the company to receive its book value (assets minus its liabilities).
To calculate P/B ratio, simply divide price by book value. It can be calculated both on a per-share basis or total company basis:
Per share P/B = Price per share / Book value per share
Total Company (P/B) = Market Capitalization / Book Value
A company’s Book Value is easily calculated from the consolidated balance sheet, and equals total assets minus total liabilities. It is also known as Shareholder’s Equity.
6– Finding the Best Stocks for Beginners: Looking for Dividends and Growth
The simple fact of the matter is:
A dividend creates compounding interest.
Receiving a dividend and reinvesting that dividend is a fantastic way to fully utilize the power of compounding interest. Dividends are a guaranteed return on investment. And companies with good dividend track records tend to grow their dividend payouts every year.

Learning how to calculate a stock’s dividend yield is the first step to understanding dividend stocks.
The dividend yield is quite easy to calculate and will often be explicitly stated next to a stock’s price as a percentage. To calculate this Yield %, just divide the dividends the company paid for the year by the current share price.
Dividend yield % = Dividend / Share Price
Next, we want to know the dividend payout %. This tells us how much of a company’s profits are being used to fund its dividend.
If a company had too high of a payout %, this could indicate a company being irresponsible. It also commonly warns of a company in trouble who is trying to hide its balance sheet failures while still paying high dividends.
To calculate this, take the dividend paid for the year divided by the company’s EPS (earnings per share found in the statement of income).
Payout ratio % = Dividend / EPS
A healthy dividend yield and dividend payout can reflect a company that is using excess cash efficiently. This tends to provide a good total return for its shareholders.
Stock Market Basics: Earnings Growth
Earnings are the name of the game for most investors and, therefore, can’t be ignored.
This is how a business grows.
That said, the type of stocks with the best earnings growth can be very volatile. Minor changes in growth can cause major upswings or downswings because of all the attention on its growth.
A high-flying stock with stellar growth may see its growth slow down and with many sellers, drive the stock down very quickly. High-growth stocks tend to be much more volatile than other stocks, and it can become a very dangerous place to invest.
To be a successful stock market investor, you have to find companies with good earnings growth that are also trading at a good price.
A good earnings growth is around 5-10%, which at least matches or beats average GDP growth. This usually indicates a stock with a very bright future.
7– The Best Way to Avoid Risk and Putting it All Together!
Through many backtests, I’ve found common characteristics in companies about to experience substantial stock price drops or bankruptcy.
One simple characteristic was too much debt when compared to shareholder’s equity.
Warning for Beginners: Avoid Risk by Avoiding Debt
Debt to equity is a common measure of risk in investing. If you think about it, it makes sense too. A person more likely to become bankrupt is one with too much debt, and the same is true for companies. If the company considered doesn’t have enough assets to cover its liabilities, or shareholders’ equity, then they have debt-to-equity ratios that skyrocket.

There are two ways to calculate debt to equity ratio: using Total Liabilities or looking at only Long Term Debt. Most financial websites will use Long Term Debt, while I like to use both Long Term Debt and Total Liabilities.
The formula for Debt to Equity using Long Term Debt is:
Debt to Equity = Long-Term Debt / Shareholders’ Equity
And to use Total Liabilities instead of Long Term Debt, you can just substitute Total Liabilities into the formula:
Debt to Equity = Total Liabilities / Shareholders’ Equity
For most companies, you like to see a Debt to Equity ratio that is below 1. There are exceptions to this rule, so be sure to read my Debt to Equity Guide for Beginners to fully understand this ratio.
Moving on to Investing in Stocks…
Congrats! You’re ready to get started investing in the stock market.
I hope you’ve enjoyed this 7 Steps to Understanding the Stock Market guide (download the full PDF, with real-life examples, here), as I’ve enjoyed sharing it.
Don’t worry about mastering it all at once. Learn over time. Like with your wealth—slow and steady wins the race.
When you’re ready, there are 2 ways we can help you:
Little Package of Valuation: Learn how to value companies using various methods, from discounted cash flow models, multiples, and much more. We have put in the reps to help you simplify a complicated process. The models included are customizable to allow you to adapt to your needs.
Value Spotlight: Stock market investors can save time and find success by discovering the right tools and resources. If you don’t know where to start, or are simply tired of wading through the endless sea of financial information, Value Spotlight was created for you.

Andrew Sather
Andrew has always believed that average investors have so much potential to build wealth, through the power of patience, a long-term mindset, and compound interest.
