Coming into this post, I generally viewed all of the total Market ETF funds as one in the same. While they are similar, when I was digging in further, the Vanguard Total Stock Market ETF (VTI) really stuck out to me, especially the VTI dividend history.
One thing that I do, for better or for worse, is that I am ALWAYS trying to optimize my life – and I mean that quite literally in every single aspect.
Whether it’s my investing, saving, planning my errands, spacing out chores around the house, planning work travel, or anything else you can even imagine – I want to do it in the most efficient way possible.

Does this mean that sometimes I will voluntarily take myself down a rabbit hole to nothingness? YUP!
But it also means that sometimes I will find things that really help improve the quality of my life.
Lucky for you, you get the pleasure (and I mean that in all
some sincerity ?) of reading about my rabbit hole to find the
most effective total stock market ETF…but, there actually is a little carrot at
the end of this rabbit hole!
So, total stock market ETFs – what are they?
Essentially, they are an index fund that is meant to mimic the returns of the total stock market, but not all funds are created equal.
I went back 18 years (I know this might seem arbitrary, but it was as far as I could find reliable data) and evaluated the dividends and the performance of five different total stock market funds, including IVV, VTI, SPY, IWV and VTSMX.
To clarify before we get into some of the numbers…I wasn’t able to find actual dividend yield history, so I took the closing price of the first day of each month that a dividend was paid and used that to calculate.
For instance, if a dividend was paid in September of 2001, I used the price on 9/01/2001 to calculate the dividend yield by taking dividend paid/stock price.
While this isn’t exact, it’s still an apples-to-apples comparison because I had to do this for all of the ETFs, so their numbers are an accurate representation.
Below you can see the chart that shows the annual dividend yield for the five different ETFs that I evaluated:
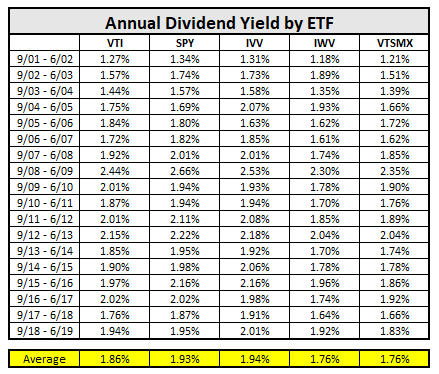
As you can see, the dividend yields are all very similar of one another. IVV has the highest dividend yield on average but both IWV and VTSMX being .18% behind on an annual average.
Looking at this might tell you that you should invest in IVV, right? Well, the dividend yield is only a portion of the equation.
You also need to evaluate what the stock prices for these ETFs have done since September of 2001.
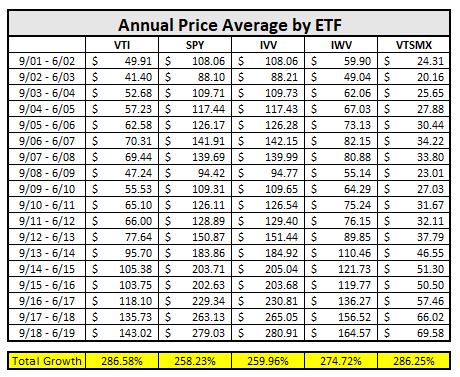
The above chart now seems pretty clear that you should invest in either VTI or VTSMX, because let’s be honest, the real goal of investing is GROWTH, right?!
Well, in the words of Lee Corso… “Not so fast, my friend!”
While VTI and VTSMX have grown the most since 2001, that doesn’t mean that they were the best investment.
When you’re evaluating history, you need to make sure that you’re getting the whole picture – and the total picture for the sort of return that you have received is Growth + Dividends – Fees = Return on Investment.
Sound easy? Clear as mud? Let’s put this into some real-world numbers now. If you had invested $1000 into each one of these stocks, how much would you currently have? Fortunately for you, I’m not actually asking you to do the math…I’ve done it for you, below!
A few assumptions that I made for this final analysis before we get into it:
- I am not taking fees into account on this comparison as fee structures have likely changed over the years and fees for ETFs are generally very similar, so for complexity purposes I haven’t included them
- I did NOT assume DRIP in these investments. I only took the dividend payment for what it is and just banked it as cash (again, for complexity purposes)
Before you take a look at the chart below, I know that it’s a ton of information and can be overwhelming, but I tried to lay it out in a way that’s easy to comprehend.
Essentially, I took the value of each the ETF each year and the total dividends paid to create a “total Value” to determine which ETF has performed the best since 2001.
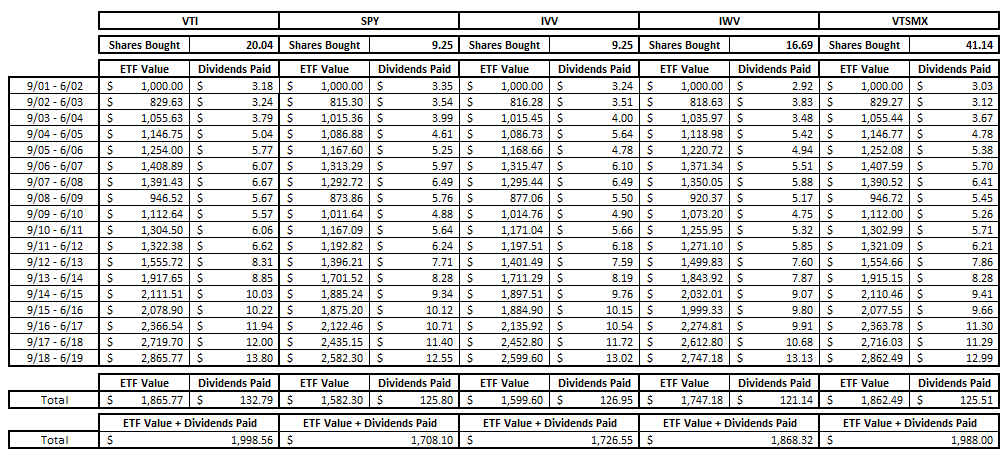
As you can see, the VTI is the best total ETF when you consider the value that the ETF has increased as well as the dividends that have been paid out through that ETF.
VTSMX is very close behind, though, and while the others are only a couple hundred dollars different, that is a big percentage difference.
Below you can see the incremental return that the VTI ETF has provided over the other ETFs since 2001.

Yes, I’ll give it to you that the .53% added value over the VTSMX isn’t anything to write home about, but the other ETFs are all significantly worse than the VTI ETF.
I mean, if someone told you that they could let you buy essentially the same thing but at a 17% better value, why would you ever say no? Exactly – you wouldn’t!
I know that this might seem like a lot of work, but I was able to spend a couple of hours investigating these ETFs and doing some research to really determine what sort of value they have returned to their shareholders, and these are the types of things that you should be doing and learning about as well as a new investor.
All in all, the time was mainly spent doing some research and then some very simple ratios and excel work and I now feel better prepared for the future.
We constantly talk about value investing as finding undervalued stocks that can outperform the market – now we’re found an undervalued ETF that historically has outperformed other ETFs that are trying to mimic the same exact thing!
