Updated 9/15/2023
Discounted Cash Flow (DCF) valuation remains a fundamental value investing model. Using a DCF continues as one of the best ways to calculate a company’s intrinsic value. Using a DCF remains the main method analysts use throughout finance, and some think using this type of valuation remains far too complicated for them.
In today’s post, we will show you once you understand the different components and how to put together the model, it is a matter of dropping in the values and out pops the valuation.
Using cash flows as an estimator of a company’s value remains a better way to go than earnings, as earnings have the ability to be “adjusted,” where cash flows are the cash left over for reinvestment or returning value to investors.
In today’s post, we will discuss:
- What is a Discounted Cash Flow Model?
- How to Find the Rates Needed to Perform a DCF
- How to Perform a DCF Valuation
- Limitations of the Discounted Cash Flow Valuation
Ok, let’s dive in.
What is a Discounted Cash Flow Model?
To sum it up, from Investopedia:
“Discounted cash flow (DCF) is a valuation method used to estimate the value of an investment based on its future cash flows. DCF analysis attempts to figure out the value of an investment today, based on projections of how much money it will generate.”
A discounted cash flow model values everything from Walmart to a person’s home; financial analysts use these models to calculate the intrinsic value of just about anything with a cash flow, i.e., bonds, buying new equipment, or valuing Walmart.

The value calculation comes from projecting the future cash flows into the future and then discounting those cash flows back to the present to give us a value today for those future cash flows.
It sounds complicated, but it isn’t; think of it this way: the value of $100 in the future equals less today because inflation causes money to lose future value.
The model we refer to as a discounted cash flow uses discount rates to discount those future cash flows back to the present—more on the topic in a moment.
The neat part of using these models is that once you arrive at your value, you can determine whether the company remains undervalued or overvalued. If the discounted cash flow results in values above the company’s current market value, the company is undervalued and could generate positive returns.
Now that we understand the discounted cash flow model let’s discuss discount rates and other inputs needed to calculate a discounted cash flow.
How to Find the Rates Needed for a DCF
To perform a discounted cash flow or DCF as it will be known going forward, we need to start with some numbers or assumptions.
The different rates we are going to need are:
- The growth rate of the cash flows into the future
- The discount rate that we will need to discount those future cash flows
- We will use the terminal rate to determine the final value of the DCF.
Before continuing, any DCF remains sensitive to any inputs we enter, especially the growth, discount, and terminal rates we decide upon. Therefore, we must remain thoughtful about our inputs as they can substantially change our DCF valuations.

Growth Rate for Cash Flows
The growth rates for cash flows and terminal rates remain the two most sensitive parts of the DCF. So, when testing our DCF models, staying as reasonable as possible is always best.
Looking at the past growth rates continues as one of the ways I like to predict the future of cash flows and project those into the future if I feel those rates remain reasonable.
Remember, we humans are terrible at predicting the future, so any number you choose is an estimate, and don’t get obsessive about the “perfect” number for any of these inputs.
One of these easier ways to achieve this goal of finding the cash flow growth is to look at analysts’ predictions from your favorite website, or you can look back at past numbers and project those forward.
Let’s pick a company and start down the path of calculating the DCF for that company.
Today, I would like to use Google (GOOG), which has a current market price of $138 and a market cap of $1,749B.
Using the predicted cash flow growth from tikr.com for the next year, they are predicting a number of 11.4%, and if I look at the growth of the cash flow over the last five years, including the trailing twelve months, or TTM, I get a value of 14.4%.
Let’s use the 14.4% as our expected growth rate for future cash flows.
Discount Rate
Next, we will find the discount rate for our cash flows. We will use the weighted average cost of capital or WACC method to arrive at our discount rate. For our purposes here, I will discuss the inputs and how to calculate the WACC; if you would like to learn more about the ins and outs of this method, please check out this post:
What is the Cost of Capital and How to Use It
Briefly, the weighted average cost of capital remains fundamental to the capital asset pricing model (CAPM). We calculate the WACC as the weighted average of a firm’s debt and equity cost.
Assuming that we are analyzing Google (MSFT), the steps for the calculation of WACC are the following:
- The first step is to find the cost of debt and the cost of equity.
The cost of debt is derived as follows, and we will take all numbers from the latest annual report:
- Google’s total debt – $29,432 million
- Interest expenses – $314 million
The interest expenses will save Google $314 million x 16.3% (tax rate) = $51 million. So, the after-tax cost of debt Rd = ($314 – $51) / $29,432 = 0.89%
We calculate the cost of equity using the formula Rs = RRF + (RPM * b), where,
- RRF: the risk-free rate or 10-year Treasury Rate
- RPM: the return that the market expects or Risk Premium
- b: the stock’s beta (systemic risk)
To find the risk-free rate, use the Treasury.gov link. And the Risk Premium uses this link, and finally, for the beta, I use stratosphere.io.
Giving us:
- Risk-free rate = 4.25%
- Equity risk premium = 5.00%
- Beta = 1.06
Rs = RRF + (RPM * b) = 4.25% + (1.06 x 5.0%) = 9.56%
- The second step is to calculate the weights of debt and equity.
First, we need to calculate the weight of debt. To do this, we will divide the debt by the sum of the total market cap plus the debt, like:
Wd = Total debt / (Market cap + total debt)
Using the following numbers we gathered earlier:
- Total debt = $29,432 million
- Market cap = $1,749,642 million
Now, let’s plug in those numbers and calculate our weighted debt.
Wd = $29,432 / ($1,748,642 + $29,432) = 2%
Next, we will calculate the weight of the equity, which will use the following formula:
We = Market cap / (Market cap + total debt)
Now, plugging in the numbers, we get a market weight equity of:
We = $1,748,642 / ($1,748,642 + $29,432) = 98%
- The final step remains to calculate the WACC.
The formula for WACC is (Rd*Wd) + (Rs*We), and plugging in our calculated costs and weights gives us:
- Cost of equity (Rs) = 9.56%
- Cost of debt (Rd) = 0.89%
- Weight of debt (Wd) = 2%
- Weight of equity (We) = 98%
Now, plugging in the above numbers, we get:
WACC = (0.89% x 2%) + (9.56% x 98%) = 9.58%
The last step is to account for the impact of taxes, so we multiply the number by one minus the current tax rate of 16.3%, giving us:
WACC = 8.26%(1-16.3%) = 9.41%
Terminal Rate
We are up to our last rate to determine before proceeding with our DCF valuation.
The terminal rate is arguably one of the more important inputs for a DCF; it largely influences the future value we arrive at.
The simplest way to determine the terminal rate is to use the same rate we used for our calculations for the discount rate or WACC to remain consistent. You could use the same rate at which the economy grows. If you try to use a terminal rate higher than that, you run the risk of the company outgrowing the economy over time, and unless you want to buy car insurance and milk from Google, that is probably not the way to go.
I use the 10-year Treasury rate, which is currently at 4.25%.
Remember, at some point, the company will have its growth return to earth and will return to match the growth of its economy, which is why we use a lower Terminal Rate.
Now that we have our rates, let’s look at how we calculate a DCF.
How to Calculate a DCF
The goal of a DCF valuation is to derive the fair value of the stock and determine whether it trades above this value (overvalued) or below this value (undervalued).

Remember, value investing sets out to find undervalued stocks, i.e., stocks trading below their fair value and, therefore, have room for growth.
The structure of creating a flow from revenues to discounted cash flows goes like this:
- Revenues
- Operating income or EBIT
- Taxes
- NOPAT or net operating profit after taxes
- Reinvestment using sales-to-capital ratio
- FCFF or free cash flow to the firm
- Discount FCFF back to present using our WACC or discount rate
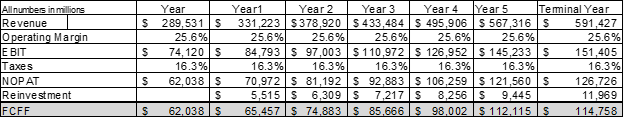
The first step is to use Google’s year-one revenues as we set up a five-year projection. Next, we grow the revenues by our earlier estimated growth rate of 14.4%.
We determine the company’s operating margin using a normalized number in the second step. We take Google’s last five-year operating margins, add them up, and divide them by giving us a normalized number. In this case, Google’s normalized operating margins give us 25.6%. We would multiply each year’s revenue by 25.6%, giving that year’s operating margin or EBIT.
Next, in the third and fourth steps, we determine the net operating profit after taxes, or NOPAT, which we calculate by multiplying the EBIT or operating income by one minus the taxes; these become our free cash flow to the firm.
The fifth step to measure reinvestment’s impact is the sales-to-capital ratio. To calculate the sales-to-capital ratio, we divide the sales by the company’s total capital, represented by the shareholders’ equity and total debt.
The sales-to-capital ratio gives us the impact of the company’s investments on the growth of the cash flows because the simple fact remains that every company must reinvest to grow.
Here is how we calculate the sales-to-capital ratio using the following numbers:
- Sales = $289,531
- Shareholders’ equity = $267,141 million
- Total debt = $29,432 million
- Cash and marketable securities = 118,332 million
The formula looks like this:
Sales to capital ratio = Sales / (Shareholders’ equity+total debt-cash)
Therefore, our ratio equals:
Sales to capital ratio = $289,531 / ($267,141+$29,432-$118,332) = 1.62
The final step includes using our WACC or discount rate to discount the current FCFF or cash flows back to the present.
Here is an example of the calculations:
Sales:
- Year 1 = $289,531 million
- Year 2 = $192,557 x (1+14.4%) = $331,223 million
- Year 3 = $227,795 x (1+14.4%) = $378,920 million
- And so on
Operating margin:
- Year 1 = $289,531 x 25.6% = $74,120 million
- And so on
NOPAT:
- Year 1 = $84,793 x (1-16.3%) = $70,972 million
- Year 2 = $97,003 x (1-16.3%) = $81,192 million
- And so on
Reinvestment:
- Year 2 = ($81,192 – $70,972) / 1.62 = $6,309 million
- Year 3 = ($92,883 – $81,192) / 1.62 = $7,217 million
- And so on
FCFF (Free Cash Flow to the Firm):
- Year 2 = $81,192 – $6,309 = $74,883 million
- Year 3 = $92,883 – $7,217 = $85,666 million
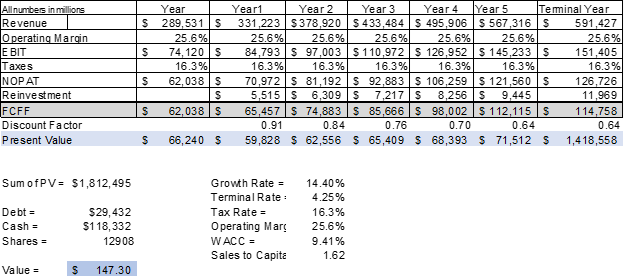
Now that we have the free cash flow figure, we can find the present value of those cash flows; the formula for that process is below.
PV of FCFF: FCFF * (1/(1+WACC)
For year two and beyond, the formula looks like this:
Dicsount rate*(1/(1+WACC))
An example of the first year is as follows:
PV = 65,457 / ( 1 + 9.41%)^1
PV = $59,828
$74,883 / (.091*(1/1+9.41%) for all five years.
We divide the previous discount rate by calculations each year to realize the current discount rate.
It flows down the structure of the chart, like below.

In the next step, we need to calculate the terminal value, assuming a growth of 4.25% beyond the forecast period.
Therefore, the FCFF in the terminal year with a growth of 4.25% equals:
- Terminal FCFF = $114,758, based on the growth of 4.25%, following the same operating margins, tax rate, and reinvestment rate.
To determine the terminal value of those cash flows, we use the formula to determine the discount rate for the terminal year’s cash flow.
Terminal value = (Terminal FCFF / (WACC – Terminal Discount rate))*Final discount rate
So, using the following numbers:
- Terminal FCFF = $114,758
- WACC = 9.41%
- Terminal discount rate = 4.25%
- Year 5 discount rate = 0.64
Plugging the above numbers into the formula gives us a value of $1,418,558 million.
The final steps include summing up the total cash flows, including the terminal value, subtracting debt, adding cash, and dividing those totals by the number of shares outstanding.
Here are the numbers we need to perform the final steps:
- Debt = $29,432 million
- Cash & Equivalents = $118,332 million
- Shares outstanding = 12,908 million
The first step means we sum up all the free cash flows, including the terminal year’s value, giving us a value of $1,812,495 million.
Next, we take the sum and subtract debt, add cash, and divide by shares outstanding, like:
Fair value = ($1,823,495-$29,432+$118,332)/12,908 = $147.30
And voila, we have a fair value calculation for Google. Not too hard, was it?
Some limitations of the DCF valuation
DCF Valuation analysis remains an extremely useful tool, provided the growth rate assumed for the series of periods stays justifiable by the firm’s operating performance. Although we cannot precisely estimate the growth rate, an expanding company seeking to enter new markets remains more likely to sustain an average growth of 14.4% for the next five years than a company contracting or losing market share. Also, the WACC calculation may not apply to the real world.
The bottom line remains that any valuation method using a DCF model or similar will contain estimates; there remains no way around the simple fact. However, using DCFs remains the best, time-tested method to determine a fair value for a company, provided we use reasonable estimates and remain cautious in using growth, terminal, and discount rates.
The big challenge remains to stay consistent with our inputs and not get stuck on finding the “right” price.
Final Thoughts
Using the discounted cash flow model to find the intrinsic value is a great way to dig into a company’s financials. The model requires you to estimate growth and discount rates, which remain open to interpretation and continue as one of the model’s weaknesses.
However, no completely estimated free models; you need to use forward or historically-based numbers. Either way, we use estimates because we have no real idea what the future will hold. But one of the most important issues is to stay consistent with your assumptions; never mix and match rates to achieve the intrinsic value you search to find, which will lead to disaster.
In our examples, we used the free cash flow, but feel free to use Buffett’s owner earnings, or you can use earnings as well. Another bonus to using the DCF valuation is that we get to touch many different parts of a company’s financials, the sales, costs, debt, equity, and free cash, which forces you to have a good pulse of the financials of any company.
However, calculating intrinsic value remains imperative to find a great price for any company we analyze. The price you pay is incredibly important and goes a long way to determine your overall returns and decisions.
When working on these models, remember to don’t get bogged down in the minutiae; focus on your assumptions and determine if they remain logical. Buffett and Munger have often repeated, “It is better to be approximately correct than precisely wrong.”
Focus on your models and assumptions; don’t worry about finding the “exact” number rather than whether your intrinsic value continues as reasonable and logical based on your knowledge of the company and the market conditions.
That will wrap up our discussion today; thank you for reading this post.
Until next time.
Take care, and be safe out there,
Dave
