How do insurance companies make money? We all think the monthly premiums we pay lead to how most insurance companies make money. Insurance companies make money on their investment portfolios, and the big question remains, how do we measure performance to determine a company worth our investment?
Everyone knows of Warren Buffett and his legendary performance as an investor, and he has used Berkshire Hathaway and its insurance float as a means for investing funds.
Unlike most insurance companies, Buffett has been investing those funds in stocks, and his prowess has earned his shareholders an immense amount of money.
My goal remains to help illuminate how insurance companies make money, how we can measure this performance, and what investments they make.
Insurance companies won’t double in a day, but they can make value investors like us wealthy over the long haul. High-quality insurance companies can generate incredible long-term returns from a business dating back to antiquity.
As we have seen with my articles on the insurance industry, the insurance companies have a language of their own; this article is another attempt to help demystify the language.
In today’s post, we will learn:
- What Investments Do Insurance Companies Make?
- Where Do I Find What Investments Insurance Companies Make?
- Net Investment Income
What Investments Do Insurance Companies Make?
Insurance companies invest in many areas, but mainly they invest in bonds. Yes, you read that right; they invest in bonds. Investing in bonds makes sense because bonds are likely the safest of all investment categories.

Being in risk management, insurance companies would logically find the lowest risk that bonds offer very appealing. But this is not the only reason.
Insurance companies like MetLife could easily take their premiums, stick them in a savings account, and call it a day. But it wouldn’t be a very good idea, and they have other ways to invest money to make more.
Investing in the premiums does two good things: investing in the premiums increases the insurance company’s profits. The investment returns allow the company to lower its premium amounts, making its policies more attractive to customers.
Insurance companies could invest in the stock market, and they do, but investing in the stock market alone would be too risky because it’s a cyclical market that swings from high bull market returns to considerable bear market losses.
An insurance company has to know with a high degree of certainty that overall, in any given year, they’re not going to absorb an unsustainable loss; therefore, stocks can only represent a relatively small portion of their investment portfolios.
For life insurance companies, stock market investments represent around 5 percent of total holdings. Property and casualty insurance companies usually invest around 30 percent of holdings in common stocks.
The appeal of bonds is that they provide a much more predictable future cash flow, but also, investment-grade bonds return markedly less on average than the long-term return of the stock market.
In 1928, $100 invested in the stock market would have grown to more than $320,000; the same amount invested in investment-grade and Treasury bonds would have grown to $7,000.
By investing only a portion of their premiums in the riskier stock market, they still participate to some extent in its higher returns without assuming the full risk of the stock market’s volatility.
But there’s one more reason for insurance companies to invest in stocks and bonds rather than bonds alone: the two investment classes are only weakly correlated. They tend to rise and fall somewhat loosely together, but not exactly. Nevertheless, there is some correlation.
An ideal third investment choice for insurance companies would be another relatively low risk that’s uncorrelated – in other words, an investment whose returns are independent.
Investment in the mortgage market, which is relatively uncorrelated, accomplishes just that. The life insurance sector of the insurance market invests about 15 percent of its premiums in mortgages and first liens. These asset classes – bonds, stocks, and mortgage instruments – comprise about 90 percent of investments for life insurance companies and over 80 percent for property and casualty insurers.
The fourth-largest asset class consists of highly liquid short-term investments and cash, totaling about 5 percent of investments for life insurers and about 10 percent for insurers in the somewhat more volatile property and casualty business.
Returning to the bond section of the investment portfolio, the U.S. insurance industry has a $400 billion exposure to the financial sector’s long-term corporate bond debt as of Dec. 31, 2011.
The three major categories within the financial sector are banking, finance, and insurance. Life insurance companies hold the majority of the U.S. insurance industry’s financial sector exposure at 75.4%, or $302 billion, followed by property/casualty (P/C) companies at 19.8%, or $79 billion.
The insurance industry held 21.8% of all corporate bonds as of 2011. As a percentage of the corporate bonds, the property & casualty had larger exposures than the life insurance companies.
Where Do I Find What Investments Insurance Companies Make?
When diving into this learning section, we will look at two documents.
We will find both of these on sec.gov; the first is the 13F, and the second is our favorite, the 10-K.

Let’s dive into the 13F first, as we haven’t discussed this before.
According to Investopedia:
“SEC Form 13F is a quarterly report that is filed by institutional investment managers with at least $100 million in equity assets under management. It discloses their U.S. equity holdings to the Securities and Exchange Commission (SEC) and provides insights into what the smart money is doing.”
The beauty of the 13F filing is you can get great insight into what the “smart” money is doing with their investments. The 13F offers a great way to discover new investment ideas and see which companies your gurus are buying.
We can also use the 13F filing with individual investors like Warren Buffet. Looking at the SEC filings for Berkshire Hathaway, you will discover what Buffett is currently holding and any recent purchases.
In these filings, you will find the number of shares they purchased, and you can determine which price they bought their companies.
One downside to these filings is they are at least 45 days behind the most recent purchase, which means you might not be able to buy Buffett’s latest company at the same price.
Let’s dive into one of these forms for a life insurance company to determine which securities they may be buying.
First, let’s look at MetLife (MET), a life insurance company with a great track record and has been around for quite some time.
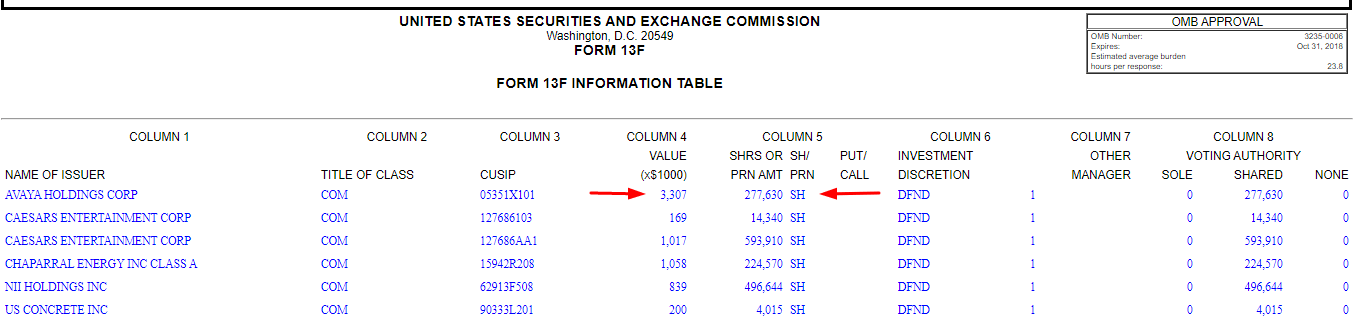
As we can see now, MetLife has some investments in securities, but its holdings are quite limited. If you want to determine the price they paid for a company, we look at the value in column 4; then, we divide by the shares illustrated in column 5.
For example, Avaya Holdings:
Value = 3307 X $1000
Shares = 277,630
Avaya Holdings = 3,307,000 / 277,630
Avaya Holdings equals $11.91 per share at purchase, and if we compare that price to the current price of $12.36, we see MetLife has made some money on the purchase, about 3.37%.
That was interesting; let’s look at another, shall we?
How about Principal Financial Group (PFG), another life insurer.
Their 13F-HR offers quite a bit more information. I can’t fit it all on this sheet; I will show you their snippet and include a link for you to go directly there to investigate further if you wish.
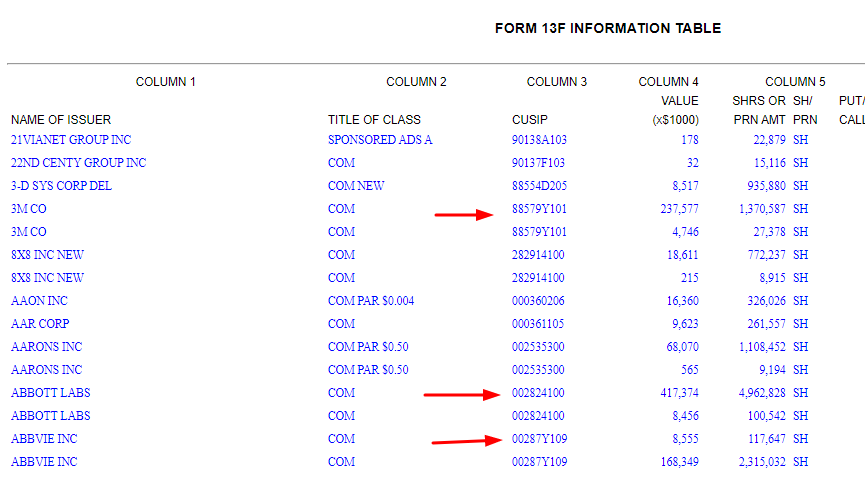
You can see in their 13F they have invested in some pretty big names, such as 3M, Abbot Labs, and Abbvie.
Respective prices paid for them when purchased:
- 3M – $173.34
- Abbot Labs – $84.10
- Abbvie – $72.72
Current prices for all three
- 3M – $121.69
- Abbot Labs – $106.91
- Abbvie – $160.48
Again this can offer us a great source of investment ideas. It can also tell us if they invest in high-risk companies or very volatile companies, which can lead to fluctuations in profits for our insurance companies.
Now that we have an idea of which companies our insurance companies might invest in, lets look at their investment portfolios as a whole and determine the profitability of these exercises.
Again we will stick with Principal for our analysis of their investment portfolio.
Diving deeper into the 10-K of Principal, we will start with their balance sheet.
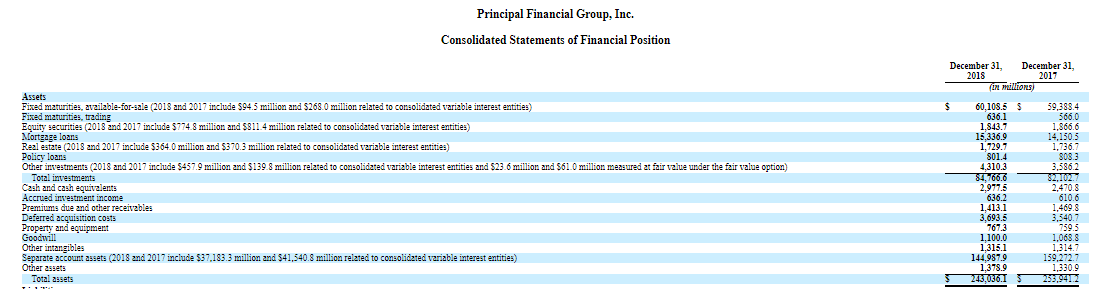
In the assets section, we can see a large section of their assets comprise investments, such as:
- Fixed maturities – i.e., bonds
- Equity securities – stocks
- Mortgage Loans
- Real Estate
- Policy loans
- And other investments
The next section will briefly break down the fixed maturities and securities. The assets can give you a good idea of the amount of money that Principal is investing. Also, notice that their investments comprise almost 1/3 of their assets and that bonds take up roughly 70% of their investment assets.
To say that bonds make up a large portion of their investment income would be an understatement.
Again, insurance companies are doing this to help stabilize their earnings and protect any claims they may have to pay out in the event of any major catastrophe.
Net Investment Income
Let’s dive into net investment income a little regarding how an insurance company invests and where this income will derive from.
To recap, net investment income is income received from investment assets such as bonds, stocks, mutual funds, loans, and other investments.
In the case of Principal, it comes primarily from bonds, stocks, loans, and real estate. We are going to investigate bonds and stocks today.
Let’s look at our income statement and discover how much income we received from our investments.
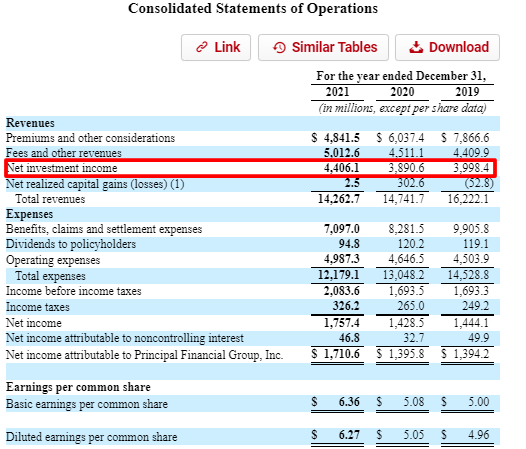
As we can see, Principal received $4,406 million in net investment income in 2021.
The net investment income comprises 30.89% of Principal’s total revenue for 2021, with that percentage holding pretty constant over the last three years.
Looking deeper at the bond portion of this income can give us some great insights into the types of bonds they are investing in and their maturities.
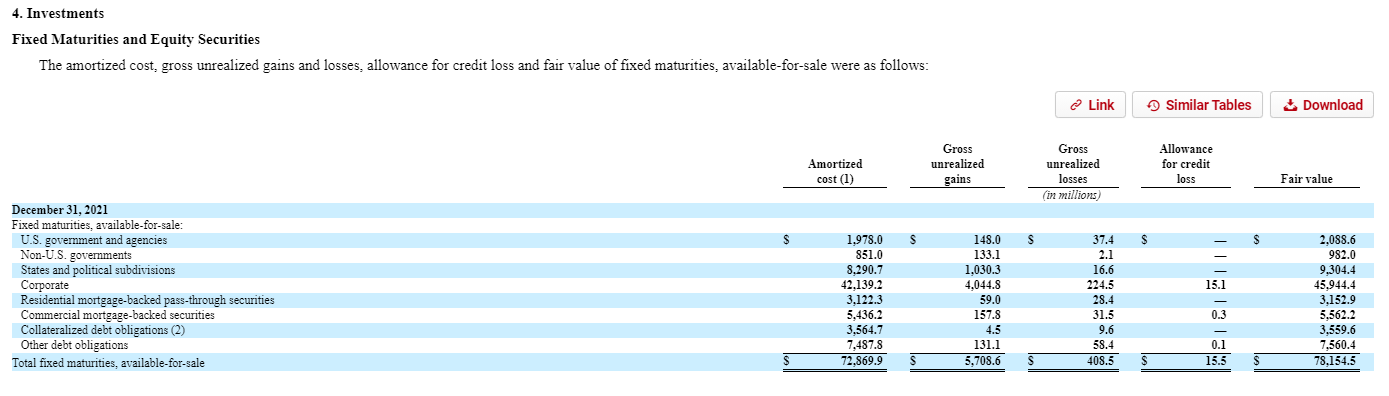
This statement comes from the notes section of the 10-K and gives us a better breakdown of the fixed assets and their fair value. It notes four from page 118 in our 10-K.
Another interesting tidbit from this statement is that we can see of their bonds investments, over 50% is with corporate bonds, which yield a better rate than U.S. government bonds but have a slightly higher risk flavor than the U.S. government bonds.
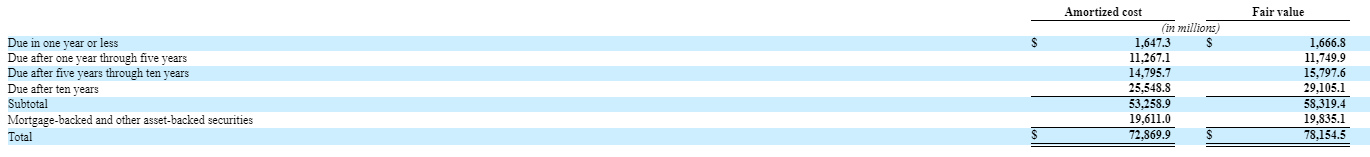
The next chart shows us the maturity time horizon of our bonds, and you can see the larger majority is greater than tens of years, which will also yield higher returns and give us more stability.
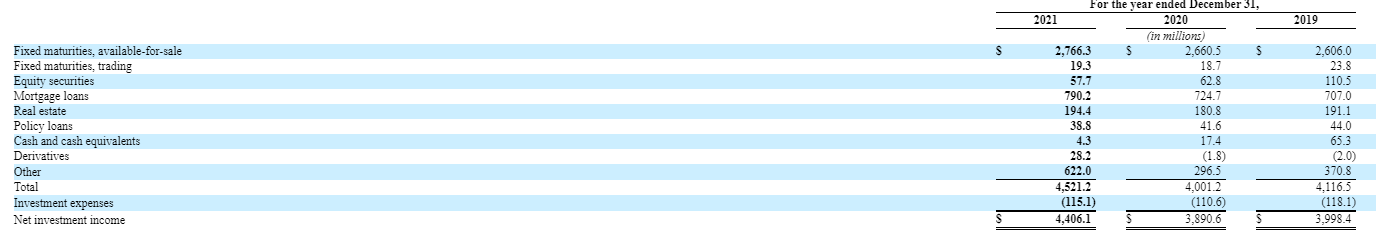
The final chart comes from page 119 of note 4 in our 10-K (find it here).
This chart gives us a complete breakdown of the major components of Principal’s net investment income. Interestingly, we received over 67% of our net investment income from bonds.
And if we compare that to our assets, we get a 3.53% return on our bonds for 2021.
How did I arrive at that number?
Well, I took the net investment income for fixed securities or bonds from Note 4 and divided that by the fixed securities from the balance sheet.
Bond return for 2021 = Net investment income bonds / Bonds assets from the balance sheet
Bond return for 2021 = $2,766 / $78,145
Bond return for 2018 = 3.53%
Pretty neat, huh?
We could also calculate an investment income return using the same filings.
Suppose we take the total net investment income and divide that by the investment assets on the balance sheet. In that case, we can derive a percentage return that we could use to compare other insurance companies to see how well they are performing in their investment portfolios.
For Principal, our numbers will breakdown as such:
- Net Investment Income = $4,406
- Total Investment Assets = $108,906
To find our investment income return, we divide the two numbers.
Investment Income Return = Net Investment Income / Total Investment Assets
Investment Income Return = 4,406 / 108,906
Investment Income Return = 4.04%
For giggles, why don’t we look at a few more companies to understand how this process works and compare investment portfolios?
I will abbreviate these steps for the next few companies to keep you awake.
The following company will be Prudential (PRU), founded in 1875 and based in Newark, New Jersey. It has a market cap of $36.7B and a current market price of $99.75.
Prudential’s total investments = $492,189
Prudentials Net Investment Income = $18,297
Prudential Investment Income = 18,297 / 492,189
Prudential’s Investment Income = 3.71%
Next, we will look at Lincoln National Corporation (LNC), founded in 1905 and based in Radnor, Pennsylvania. It has a market cap of $5.21B and a current market price of $30.82.
- Lincoln Financial’s Total Investments = $153,630
- Lincoln Financial’s Net Investment Income = $6,115
Lincoln Financial’s Investment Income = 6,115 / 153,630
Lincoln Financial’s Investment Income = 3.98%
That was an interesting look into the investment performance of some of the bigger insurance companies. A few of them were better performers, such as Principal and Lincoln Financial.
Because of the new accounting rules and how to assess investment portfolios, it is nearly impossible to calculate an investment return for Berkshire Hathaway, which is a shame because Warren Buffett is the ultimate maestro.
Final Thoughts
This deep dive into the investment portfolio of insurance companies is necessary to investigate an area of creation for a large portion of their income.
Particularly with life insurance carriers, this investment portfolio will be a larger factor than for property/casualty insurers.
We noticed that many of their investments are in fixed securities such as bonds and, in some cases, real estate. Because of how insurance companies work, the nature of claims, and the timing of claims, the use of bonds or other very stable investments is critical.
Few insurance companies will have large portfolios of securities in terms of dollars invested compared to the amounts invested in bonds.
The simple formula we discovered can be useful in determining the investment performance of our insurance companies and using that as a comparative tool; ideally, all things being equal, finding a company generating great returns on their invested capital.
This post is part of an ongoing series to help peel back the confusion surrounding insurance companies and how they make money. Once you understand how these businesses make money and the language used, we have seen that they are not all that different from “normal” businesses.
Thank you for taking the time to read this post, and I hope you found something useful for your investing journey.
If you have any questions or need further guidance, please don’t hesitate to reach out.
Take care,
Dave
