Insurance, one of the necessary evils of today’s world, right? We all have to have it in case of that one day you will need it, health, life, auto, home, and on it goes. The big question is, how do I invest in an insurance company when I don’t understand how it works or how they make money?
Well, you’re in luck because today we are going to tackle all of those questions and more.

Question for you, do you know what Warren Buffett has invested most of his money into and how he makes most of his money?
Ding, ding, ding, you are correct! It is in the insurance industry, heard of Geico before? Yes, that little green gecko is peddling insurance for Uncles Charlie and Warren.
That’s right because at the core of what Berkshire Hathaway does is function as a holding company for a basket of businesses, among which are several extremely successful insurance companies, Geico being the most recognizable.
Buffett has been able to use the profits from his insurance businesses to invest that money from the “floats” of his insurance business into many other very profitable investments. The float has been the bread and butter of his whole operation.
More on floats and how they work in a moment, let’s move on to how does an insurance company work.
How Insurance Companies Work
So how do insurance companies work, and what makes them so darn confusing?
The basics of an insurance company are that they exist to spread risks around them among a bunch of different customers. A great way to think about an insurance company is like a bank; they take in deposits, or your premiums, and allow you only to withdraw money when you experience a large financial loss.
Probably the best example would be a homeowners insurance policy, as your home is probably the most expensive thing most of us will ever own. So homeowners insurance is bought to protect us from financial risks in the case of being destroyed by fire, wind, or some other disaster. A policy like this costs maybe 1% to 2% of homes value in premiums each year.
This scenario would apply to all different kinds of insurance like health, auto, life, etc. And every different policy has some built-in factors to help protect you as well as the company insuring you.

So how does an insurance company determine what premiums I have to pay? Glad you asked because the insurance company will determine the premiums before the actual costs of damage are known and can vary based upon the type of insurance.
Because the insurers don’t have crystal balls and can’t foresee the cost of any damages, they are forced to base their premiums on the severity of each claim in terms of actual cost and how frequently people file claims.
The insurance companies also work to regulate fraud, people filing false claims, in order to keep premiums down.
See they are trying to help us; they are not all evil and out to get us.
Next question, what happens to my premiums when I pay them to the insurance company?
The money we pay to the insurance company distributes it in three ways.
- To help pay others’ expenses – part of the monthly premium you pay will help pay for repairs incurred by others, or to help pay for your repairs if needed.
- To cover the expense of “underwriting” – Underwriting fees are the costs involved in operating an insurance business. The money is used to pay for taxes, state fees, salaries, any expense that is necessary to operate a business.
- It’s invested – To recover underwriting losses, insurance companies also use money collected from premiums for investments. The investments help insurance companies keep your premium low and create more wealth for the shareholders.
Now that we understand what an insurance company is, the next question would be, how do they make money?
How do Insurance Companies Make Money?
The simplest way to explain how insurance companies make money is that they bet on risk – risk that you won’t die before your time or the risk that your house won’t burn down, or that you won’t get in a car accident. All of which would cause the insurer to pay out to you the insurer.
The basic concept that drives the insurance company revenue model is an arrangement with an individual, company, or organization where the insurer promises to pay a specific amount of money for a specific asset loss by the insured, usually by damage, illness, or in the case of life insurance, death.
In return, the insurance company is paid regular, usually monthly payments from its customers. These insurance policies can cover life, auto, home, travel, business, illness, and other assets.
These are the contracts that the insurance signs between the insurance company and the insurer, where the insurance company promises to pay out for any losses to insured in exchange for regular, smaller payments made by the insurer to the insurance company.

Keep in mind that insurance companies are a for-profit business whose business model is is to collect more cash than it pays out to its customer’s while factoring in the costs of running their business.
The way that they do this is built on twin pillars: underwriting, and investment income.
Underwriting Income
Underwriting incomes come from underwriting revenues from the cash collected on insurance policy premiums, minus money paid out on claims and for operating the business.
For example, let’s say that Aflac earned $5 million from premiums paid out by customers for their policies.
On the flip side, let’s say that Aflac paid out $4 million in claims in the same year. That means on the underwriting side, Aflac earned a profit of $1 million ( $5 million minus $4 million = $1 million ).
The above example is fairly simple, and we will explore this a little more in-depth.
Keep in mind that insurance companies go to great lengths to ensure that they are set up to make money, by using key metrics and other devices to make sure they are set up for success.
Insurance companies work very hard on crunching the data and algorithms that indicate the risk of paying out on a policy.
If that data tells them the risk is too high, they either deny the insurance policy or create a premium high enough to ensure profitability. If the data tells them the risk is low, then they will comfortably write a policy with the knowledge that paying out will be low.
Investment Income
Insurance companies also make a boatload of money from investment income. When an insurance company receives its monthly premiums, the insurance company takes those monies and invests them in the financial markets, to increase their revenues.
A large portion of the investment income is invested in the bond market, either in government or corporate bonds, thus insurance companies are among the largest investors in the bond markets and are sensitive to changes in interest rates.
With a large portion of the insurance companies’ balance sheet containing lower-risk assets like government bonds and high-grade corporate bonds, these classes of assets provide certainty of returns to the insurer.
The yield obtained from these investments is much lower than other classes of assets.
Life insurance companies typically have a much higher proportion of fixed assets like bonds, versus equities. Whereas Property & Casualty, companies can have a larger portion of equities, while still heavily invested in the bond market.
Float
What is insurance float, you ask? Well, this is a term that Warren Buffett has made famous, albeit not one that he invented. He has credited it with his ability to generate quite a lot of wealth for himself and his shareholders.
According to Investopedia:
“Float, or available reserve, is the amount of money on hand at any given moment that an insurer has collected in insurance premiums but has not paid out in claims. Insurers start investing insurance premiums as soon as they are collected and continue to earn interest or other income on them until claims are paid out.”
In short, a float is the money that an insurance company gets to hold between the time customers pay premiums, and the time customers make claims on their policies.
This from the Oracle of Omaha on the insurance float:
“Insurers receive premiums upfront and pay claims later. … This collect-now, pay-later model leaves us holding large sums — money we call “float” — that will eventually go to others. Meanwhile, we get to invest this float for Berkshire’s benefit. …
If premiums exceed the total of expenses and eventual losses, we register an underwriting profit that adds to the investment income produced from the float. This combination allows us to enjoy the use of free money — and, better yet, get paid for holding it. Alas, the hope of this happy result attracts intense competition, so vigorous in most years as to cause the P/C industry as a whole to operate at a significant underwriting loss. This loss, in effect, is what the industry pays to hold its float. Usually, this cost is fairly low, but in some catastrophe-ridden years the cost from underwriting losses more than eats up the income derived from the use of float. …”
That pretty much sums up insurance float, and is particular to the insurance industry at this point. No other business that I am aware of exhibits the ability to generate a float that they can use to create income for themselves.
How we calculate insurance float is a little complicated, and we will tackle that in a future post. For now, it is enough to understand what it is and how it works.
Accounting 101 for Insurance Companies
Before we start to dive into different metrics we would use to value an insurance company, let’s take a look at the financial statements and explore some of the differences that we will see from an Income Statement and Balance Sheet.
The terminology can be different, and I thought it might be a good idea to flesh the terminology out a little bit.
For insurance companies, we are going to start with the Income Statement because everything flows from the premiums that insurance companies collect from their customers.
Don’t worry, the Balance Sheet is important, but we will focus on the main source of revenue first.
Income Statement
Different in that we will not see Cost of Goods Sold and Operating Expenses, let’s look at how insurance companies set up their Income Statements.
- Revenue: Premiums, Net Investment Income (mostly interest), Net Investment Gains / (Losses), and Other Fees / Revenue.
- Claims and Expenses: Claim and Claim Adjustment Expenses (what they pay out to customers who get in accidents, damage property, get sick, etc.), General & Administrative Expenses, Acquisition Costs (How much in commissions they’re paying to acquire customers), and Interest Expense.
- Pre-Tax Income = Revenue Minus Claims and Expenses.
- Net Income = Pre-Tax Income * (1 – Tax Rate).
The most confusing part of insurance income statements is revenue and expense recognition.
Here’s an example of how you would recognize revenue and expenses:
“Let’s say a customer signs up for a $10,000 1-year insurance policy mid-way through the year on June 30.
You’d record the $10,000 as a written premium, but you could not recognize it all as revenue: only half, or $5,000, would be earned in that year, and only that $5,000 in earned premiums would count toward your revenue for that year.
On the expense side, you assume that each dollar of earned premiums carries with it a certain percentage in the claim and claim adjustment expenses. So if it’s 75% in this case, you’d record $3,750 in this first year.
For single-year policies, it’s pretty straightforward – but the real fun begins when you have policies that last for 2-3 years or even 20+ years in the case of life insurance.
With those, you still record on the income statement the estimated claim and claim adjustment expense that matches up with the premiums you’ve earned in a given year…
…But your actual cash payout of those expenses may be much different. So you might end up paying out 60% in year 1, 30% in year 2, and 10% in year 3, which means that there’s a big difference between recognized expenses and cash expenses.
On top of all that, insurance companies often re-insure policies of other insurance companies, and, in turn, often have other insurance companies re-insure their policies.
So to figure out your net earned premiums – the figure that counts toward revenue – you need to add in anything your company is re-insuring (called “assumed premiums”) and subtract out anything that other companies are re-insuring for you (called “ceded premiums”).”
Got all of that? I know it is a little confusing, but like any exercise, as you use it more, the more you will get comfortable with these terms.
Balance Sheet
Assets Side:
- Investments: Fixed Income, Equities, Real Estate, Joint Ventures, Short-Term Investments.
- Non-Investment Assets: Cash, Premiums Receivable (similar to Accounts Receivable), Reinsurance Recoverables, Ceded Unearned Premiums, Deferred Acquisition Costs, and then the usual assets like Goodwill, Other Intangibles, and so on.
I know there are some unfamiliar terms here, but we need to address the liability side, and then we will tackle the asset side.
Liabilities & Shareholder Equity Side:
- Liabilities: Claim and Claim Adjustment Expense Reserves, Unearned Premium Reserves, Debt, Other Payables, Other Liabilities.
- Shareholders’ Equity: Preferred Stock, Common Stock, Noncontrolling Interests, APIC, Treasury Stock, Retained Earnings, and Accumulated Other Comprehensive Income.
Here are the two most important new terms:
- Claim and Claim Adjustment Expense Reserves: Remember how the claims expenses paid out in cash differ from what is recognized on the income statement? This reserve reflects those differences. Each year you add the amount that’s recognized and subtract what you pay out in cash, so effectively the reserve always reflects how much you still have to pay out in cash in the future.
- Unearned Premium Reserves: Remember how you only recognize a portion of the premiums you write each year? That’s what this is for. Each year, you add the premiums that you’ve written and then subtract out what you’re recognized as revenue so that this number always reflects what you will recognize as revenue in the future – similar to deferred revenue.
Two of the unfamiliar items on the assets side are directly related.
Reinsurance Recoverables means the Claim and Claim Adjustment Expense Reserve.
Ceded Unearned Premiums means the Unearned Premium Reserve, but for policies you have ceded to other insurance companies.
The last one, Deferred Acquisition Costs, is simpler: each year, you have to pay a commission on written policies that were referred to you by brokers and salespeople.
But due to the matching principle of accounting, you can’t recognize that entire cash expense since you do not recognize that entire written premium in one year.
So you recognize on the income statement only the percentage that matches the premium percentage you’ve earned, and then defer the rest and recognize it over time, and that’s what the Deferred Acquisition Costs asset is for.
Good news is that after all the differences in the income statement and balance sheet when we arrive at the Cash Flow Statement, it is set up like any other publicly-traded company.
Let’s look at how everything flows from each statement to statement.
- Start by projecting the company’s Direct Written Premiums – how much they’re selling themselves – and then how much in premiums they assume from others and how much they cede to others, along with what percentage is earned each year.
- Then, project the Claim and Claim Adjustment Expense Ratio, the commission rate, and the percentage of underwriting expenses associated with the written premiums each year.
- You list the company’s Net Earned Premiums as well as its interest and investment income for revenue on the income statement; expenses consist of Claims, Commissions, Underwriting Expenses and Interest, and you get to Pre-Tax Income and Net Income the normal way.
- The balance sheet flows directly from the company’s revenue/expense recognition (the reserves and corresponding items on the assets side) and cash and shareholders’ equity flow in as they normally would.
- The cash flow statement works the same way as well: start with net income, adjusted for non-cash items and the balance sheet, and get to the net change in cash at the bottom by projecting cash flow from investing and cash flow from financing.
How to read insurance companies financial statements is important for us to be able to value these companies. As you have seen, the accounting terms are different, but once you understand the terms and what they stand for, it is easier to pick out what is important.
Metrics Used to Value an Insurance Company
Let’s talk about some metrics that we can use to give us a preliminary flavor of the value of an insurance company. A few of these are going to be metrics that will be familiar to a lot of you, the oldies but goodies section.
The first metric to consider is Price to Book or P/B; this metric calculates the comparison of the company’s price to its book value.
Price to Book = Market Share Price per Share / Book Value per Share
You can calculate the price to book by taking the market price per share, which is easy to find; any stock market app will give you the price.
Calculating the book value per share means that we take total assets subtract them from the total liabilities and divide that by the number of shares outstanding. You can find all of the numbers needed for this formula on any insurance company’s balance sheet.
Next ratio to consider is Price to Tangible Book Value, P/TBV tells us how much we are paying for the company’s physical assets. It excludes intangibles assets like patents or goodwill.
In the banking world and the insurance world, this metric is used quite frequently. A good rule of thumb is to look for a P/B below 1, which will indicate an undervalued company, whereas a P/B above 2 would indicate an overvalued company.
The formula for Price to Tangible Book Value is calculated by dividing the price per share by the tangible book value. You can find the tangible book value by subtracting the intangible assets like patents, goodwill, etc. from the company’s book value.
Profitability Ratio
Next up is Return on Equity, which helps us measure the income level of an insurance firm is generating as a percentage of the shareholders’ equity or book value. An ROE of around 10% indicates an insurance company is covering its cost of capital and generating an ample return for us shareholders. The higher, the better, and a ratio in the mid-teens is ideal for a well-run insurance company.
For more details on how to calculate this formula, please follow this link for a more in-depth look into this formula.
Combined Ratio
The last ratio we are going to look at is the combined ratio, for which I will give you a brief overview. A more in-depth post on the combined ratio can be found here.
For our purposes here, the combined ratio measures the incurred losses and expenses as a percentage of earned premiums. A ratio above 100% means the insurance company is losing money, where a ratio below 100% suggests an operating profit.
We can calculate the combined ratio by adding the loss ratio and expense ratio, calculating the loss ratio by dividing the incurred losses, including the loss adjustment expense, by earned premiums.
You calculate the expense ratio by dividing the incurred underwriting expenses by the earned premiums.
Easy, huh, as I mentioned earlier; we will dive into this much more soon.
Now that we have spent some time researching how insurance companies work, how they make money, and what kinds of metrics to use to value a company.
Let’s start to put this to actual use and value a couple of insurance companies.
Examples of Insurance Company Valuation
The first insurance company I would like to examine is Allstate, a Property & Casualty based out of Northbrook, Illinois. Founded in 1931, Allstate specializes in auto, home, renters, commercial policies.
The market cap for Allstate is $33.48 Billion, with an enterprise value of $37.49 Billion. The current market price of Allstate is $101.69, as of August 14, 2019.
First let’s assess a few of the metrics that we discussed earlier.
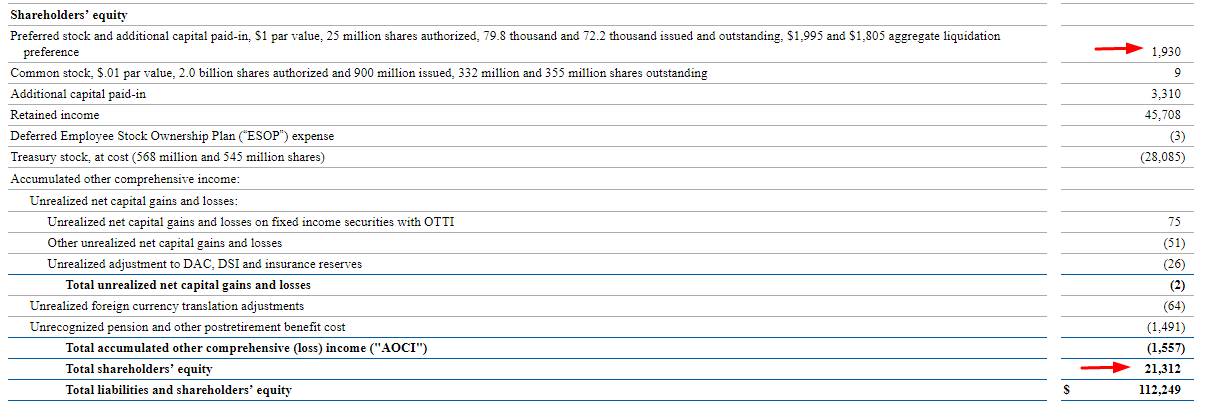
Price to book for Allstate is currently 1.50, and the Book Value per Share is 55.98. All of which based:
- Shareholder equity of $21,312
- Preferred stock of $1,930
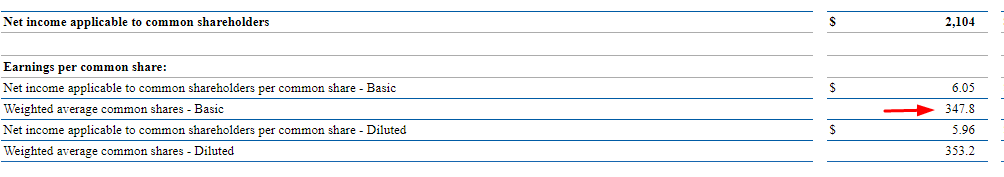
- Shares outstanding of 347.8
The shareholder equity and preferred stock are both found on the balance sheet.
And the shares outstanding can be found in the income statement.
Now let’s look at Price to Tangible Book, which based on:
- Market cap – $33.48 billion
- Tangible Equity, which comprises of:
- Total Shareholders equity – $21,312
- Preferred stock – $1,930
- Goodwill – $2,530
The formula for Price to Tangible book is as follows:
Price to Tangible Book = Market Cap / ( Total Shareholders equity – preferred stock – goodwill )
Plugging in the numbers we get:
Price to Tangible Book = 33.48 / ( 21312 – 1930 – 2530 )
Price to Tangible Book = 33.48 / 16.85
Price to Tangible Book = 1.98
Hopefully, you could follow all of that; it is pretty easy once we plug in the numbers, which by the way we can gather all of them from the balance sheet.
Next up on our list is to calculate the Return on Equity for Allstate. Let’s get our numbers and do a calculation.
The formula for ROE, as a refresher:
ROE = Net Income / ( ( Total Shareholders Equity 2017 + Total Shareholders Equity 2018 ) / 2 )
Our numbers for the ROE will be:
- Net Income – a note for this number, you will
find it in the income statement, but we need to subtract preferred dividends to
get the correct number.
- Net Income – 2252
- Preferred dividends – 148
- Net Income – ( 2252 -148 ) = 2104
- Total Shareholders Equity 2017 – 22551
- Total Shareholders Equity 2018 – 21312
Plugging in the numbers, we get:
ROE = 2104 / (( 22551 + 21312 ) / 2 )
ROE = 2104 / 21931
ROE = 9.59%
Continuing with our analysis, let’s take a look at our combined ratio for Allstate.
The formula for the combined ratio is:
Combined Ratio = Loss Ratio + Expense Ratio
Let’s break that down a little bit; I am going to take a big-picture view of this ratio as I will cover this in a lot more depth in my next post.
Starting with the loss ratio, we are looking for a few numbers:
- Incurred Losses
- Loss adjustment Expenses
- Earned Premiums
Now let’s put this together, keep in mind that some of these terms may be foreign to you if you haven’t done a deep-dive into an insurance company before.
We will gather all of our information from the section titled Summarized financial data on page 41 of the 2018 10-k.
In Allstate’s case, they lump both the incurred losses and loss adjustment expenses into a category named Claims and claims expense.
Additionally, the earned premiums are titled premiums earned.
So, to calculate the loss ratio we simply:
Loss ratio = claims and claims expense / premiums earned
Loss ratio = 22495 / 32950
Loss ratio = 68.2%
Next up is the expense ratio, which will include these terms:
- Expenses
- Earned premiums
Looking at our table from the 10-k we will use these terms and corresponding numbers:
- Amortization of DAC – 4475
- Operating costs and expenses – 4545
- Restructuring and related charges – 76
- Other revenue – 738
- Premiums earned – 32950
Putting this all together now, we come up with this formula.
Expense ratio = ( Amortization of DAC + Operating costs + restructuring – other revenue ) / Premiums earned
Expense ratio = ( 4475 + 4545 + 76 – 738 ) / 32950
Expense ratio = 25.4%
Now we add these two percentages to find our combined ratio for Allstate.
Combined ratio = 68.2% + 25.4%
Combined ratio = 93.6
Now, what does this number tell us?
It tells us that Allstate that is operating with a profit from their insurance operations, the lower the number, the better.
You can also find the combined ratio in any insurance company’s financial reports by using the “Ctrl-F” function and searching for the term combined ratio, but this is cheating, and we don’t cheat.
By now, we have worked through a few ratios which have given us a good idea of the profitability of our business, as well as how they operate by looking at different sections of each financial statement.
The last step to determining whether or not our insurance company is a viable investment for us is to try to determine an intrinsic value.
My preferred method would be to utilize a dividend discount model to give us an idea of intrinsic value. You could try a discounted cash flow model, but with an insurance company, it is a little trickier because of the nature of the business.
The way insurance companies make money and have to pay out claims can cause a ton of fluctuations in the cash flow; the nature of premiums makes it more difficult. You receive money with the promise that you might have to pay it back to the customer in the future.
Let’s put together a dividend discount model and gather some numbers to help us determine our intrinsic value for Allstate.
- Current Dividends – $1.84
- Dividend growth – 7%
- I am using a median for the growth rate of the dividends over the years. Trying to be more conservative and in the ballpark
- Required rate of return – 9%
- I am basing this on the historical return of the stock market over the last 100 years.
A refresher on the formula is as follows:
Dividend Discount Model = Current dividend + ( 1 x growth of dividend ) / ( required rate of return – growth rate )
Plugging in our numbers from above we get:
Intrinsic value = 1.84 x ( 1 x .07) / ( .09 – .07 )
Intrinsic value = $98.44 for Allstate
Comparing this to the current price of $104.50 indicates it might be a little overvalued, by about 6.1%. It appears that the company is overvalued but at a 6% margin that is pretty thin to base an investment decision.
One thing to keep in mind when using any valuation metric, the final number is only as good as your assumptions.
For example, if I think the growth rate of the dividends is low and I raise it to 8%, raising the rate drastically increases our intrinsic value to $198.72, which is up to you to determine whether or not that is realistic or not.
What I like to do is to do a range of rates to help me determine which outcome I think is more realistic, but don’t obsess about finding the perfect number because it doesn’t exist.
Using a range of growth rates for the dividend gives us these outcomes:
- 5% – $48.30
- 6% – $65.01
- 7% – 98.44
- 8% – $198.72
Which do you think is more probable? The key is to play around with different rates to help you come up with an intrinsic value you think is most probable and gives you a margin of safety in case we are wrong.
Based on all the information that we have used to look at all the metrics and do a quick intrinsic value calculation, it appears to me that Allstate is fairly valued at the moment.
It looks like there might be some room for growth and is possibly undervalued, but there is not a large enough margin of safety for me to feel comfortable about investing in this company at the current price.
Let’s take a quick look at one more company to give us another example of how this process works.
Metlife (MET)
Metlife is a life insurance provider primarily but also provides additional services in health, dental, etc. Metlife was founded in 1868 and is headquartered in New York City.
MetLife has a market cap of $43.27 Billion with an enterprise value of $38.92 Billion, and their current share price is $46.21 as of August 14, 2019.
Running through our checklist of metrics:
Price to Book – 0.69
Book Value per share – $55.02
Price to Tangible Book – 0.91
Price to Earnings – 8.31
Return on Equity – 8.94
Combined Ratio – is going to be a little different as we can’t do a combined ratio for life insurance companies. The way life insurance companies make money is predicated on their investment portfolios than underwriting.
For a life insurance company, instead, we will focus on an expense ratio to give us a better idea of profitability.
The formula for the expense ratio for MetLife is as follows:
Expense Ratio = ( Other Expenses + Capitalization of DAC ) / ( Premiums + Fees + Other revenues )
We will gather the numbers from the 2018 10-k, page 210:
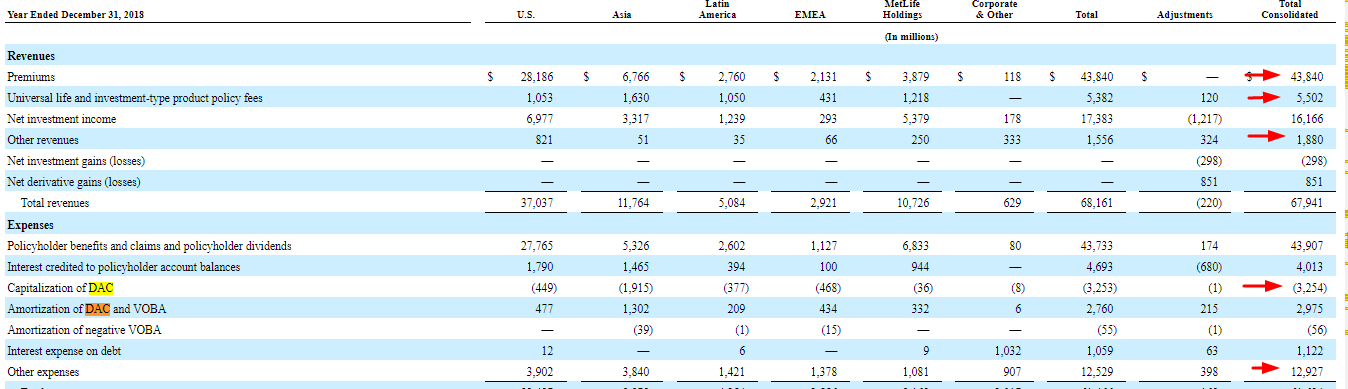
Pulling our numbers from the 10-k we get:
- Other expenses – 12927
- Capitalization of DAC – (3254)
- Premiums – 43840
- Policy fees – 5502
- Other revenues – 1880
Putting it all together we get:
Expense ratio = ( 12927 + (3254)) / ( 43840 + 5502 + 1880
Expense ratio = ( 9673) / ( 51222 )
Expense ratio = 18.88%
The big question is, how does this number stack up? In the grand scheme of things, it isn’t a final number, but rather a precursor to indications of profitability.
Generally, anything under 20% is going to be a good barometer of profitability, but keep in mind that a life insurance company is also going to generate a large portion of its profits from its investment income.
Lastly, let’s take a look at the dividend discount model, and plug in some of our numbers.
First, the current dividend is $1.76 per share. Next, we have our cost of equity which I am going to set at 9%, which would be the growth rate of the stock market over the last 50 years. Lastly is the growth rate of our dividend, which I am going to use like 4%.
So our numbers will be:
Intrinsic Value = 1.76 ( 1 – .04 ) / ( .09 – .04 )
Intrinsic Value = $34.53
As before let’s look at some different growth rates to give us a range of values.
- 3% – $28.50
- 5% – $43.58
- 6% – $58.65
To show you how changing one rate can change our intrinsic value, say we change our cost of equity to 8.34, which we would get if we plugged all the numbers into our equation for cost of equity.
The range for this cost of equity with a range of growth rates for the dividend:
- 4% – $39.78
- 5% – $52.19
- 6% – $75.20
So we can see that this raises our possibility of a higher intrinsic value. Which one do we use?
I would go with the growth rate of the stock market over the last 50 years, that is a pretty good indicator of the growth of the company. Next thought would be to look at somewhere between 4% to 5% for the growth rate of the dividend. If you look at the growth of the last five years, it is in that range, with which I am comfortable.
The intrinsic value at those growth rates would be:
- 4% – $34.52
- 5% – $43.58
My thought is the intrinsic value would be closer to the $40 to $42, with the current price of $43.71, we can see MetLife fairly valued at the current time.
All the other metrics that we used to look deeper in Met indicate to me that it is possibly undervalued and appears to have some room to grow, but the market doesn’t appear to share that same sentiment at the current time.
MetLife wouldn’t be an investment I would make at this time because of the zero margin of safety, but it is a stable company that pays a nice dividend that is growing.
Final Thoughts – Evaluating Insurance Stocks
We have taken a look under the hood to illuminate how insurance companies make money, as well as exploring the different accounting terms associated with insurance companies.
Also, we have looked at some of the different metrics that can be used to both screen for undervalued insurance companies and help us determine the profitability of said businesses.
Terms like Return on Equity, Tangible book, Price to Book, Price to Earnings are all metrics that we have explored before using different industries like banks, for example.
Hopefully, you had learned that investing in insurance companies is not as scary and daunting as it might have been when we first started this journey.
Once you learn the meaning behind some of the different terminologies and understand how they make money, they are just like any other business.
Plus they are a great source of dividends that are growing and are fairly stable businesses without a ton of volatility attached to them.
As always, thank you so much for reading, and I hope you found something of value to help you with your investing journey.
Take care,
Dave
