Updated 5/1/2024
In this post, you will learn how to use the Altman Z-score to avoid companies on the verge of bankruptcy.
This guide will include lots of:
- What is the Altman Z-Score?
- The Altman Z-Score Formula
- How to Calculate the Altman Z-Score with Real-Life Examples
- What is a Good Altman Z-Score?
This guide is for you if you are looking for a formula to help you avoid companies on the brink of bankruptcy.
Let’s dive right in.
What is the Altman Z-Score?
According to Investopedia:
“The Altman Z-score is the output of a credit-strength test that gauges a publicly traded manufacturing company’s likelihood of bankruptcy. The Altman Z-score is based on five financial ratios that can be calculated from data found on a company’s annual 10-K report. It uses profitability, leverage, liquidity, solvency, and activity to predict whether a company has a high probability of becoming insolvent.”
It mentions that we use the Altman-Z score with manufacturing companies, but you can use it with other industries. Only financials are out of bounds as it doesn’t adapt well to that industry.
A little history about the Altman Z-score: it was developed in 1967 by Edward Altman, an NYU Stern finance professor. His findings were later published in 1968.
Over the years, Altman has worked on tweaking his Z-score. Over the years, he has evaluated companies using the following score:
- 1969 to 1975, 86 companies were in distress
- 1976 to 1995, 110 companies were in distress
- 1996 to 1999, 120 companies were in distress
Altman found through his studies that the accuracy of his Z-score ranged between 82% to 94%.
In 2012, Altman released an updated version that we could use to evaluate public and private companies, all industries except financials.
How to Use the Altman Z-Score
We can use the Altman Z-score to evaluate corporate risk, and the formula has become a reliable way to measure businesses’ credit risk.
This model focuses on protecting our downside. Predicting bankruptcies is hard, but avoiding permanent loss of capital is rule number one.
As we will discover, a high Altman Z-score doesn’t indicate a strong buy, merely a low chance of bankruptcy. However, a low Altman Z-score raises questions about the financial strength of the said company and should be a red flag that we should investigate.
One of the main issues with the Z-score is it is not well-suited for specific industries. Industries with high leverage, such as airlines like Boeing, will naturally show a higher risk of bankruptcy.
Others that will have issues because of possible negative working capital, such as restaurants and retail, will exhibit higher bankruptcy levels.
The efficiency of the score in predicting bankruptcies has fallen over the years. Still, for me, the reason why I like to use it is the ability to determine a quality company. I will not tell you whether companies are going bankrupt; I will use Andrew Sather’s Value Trap Indicator.
The Altman Z-score can give us a good check on a business’s credit and quality. As we will see, the Altman Z-score lines up nicely with a company’s bond ratings, which tell us the overall financial strength of a business.
As with our study of bonds, the bond rating indicates a financially secure business, but it is not necessarily a predictor of bankruptcy.
Most of those signs are fairly obvious:
- Overloaded debt
- Short-term debt is higher than long-term debt
- Cash from financing operations greater than cash from operations
And many more, but that is for another time.
Now that we have explored the Altman Z-score and ways to utilize the formula let’s dive in and discover it.
The Altman Z-Score Formula
Here is the formula; it may look complicated, but we will break down each part.
Z = 1.2*X1 + 1.4*X2 + 3.3*X3 + 0.6*X4 + 1*X5
Where:
- X1 = Working Capital / Total Assets
- X2 = Retained Earnings / Total Assets
- X3 = EBITDA / Total Assets
- X4 = Market Value of Equity / Total Liabilities
- X5 = Net Sales / Total Assets
To start implementing this, let’s examine each component and break it down a bit, as well as identify where to find the data we need.
Here is a list of the items we need to locate to calculate the formula.
- Total Assets
- Total Current Assets
- Total Current Liabilities
- Retained Earnings
- Pre-Tax Income
- Interest Expense
- Revenue
- Market Cap
- Total Liabilities
Let’s dive into a look at some examples of real companies.
How to Calculate the Altman Z-Score with Examples
The company I would like to use for our example is Oshkosh Corp (OSK), a manufacturing company that, among other items, makes the Hummer.
Altman X1
Altman X1 = Working Capital / Total Assets
The above breaks down as follows:
Altman X1 = (Current Assets – Current Liabilities) / Total Assets
It is a nice, simple formula to understand. Based on figures from the balance sheet, it lays out the company’s short-term financial position.
Remember, the more working capital compared to the total assets, the better liquidity the company has available.
I have a few notes regarding working capital: Negative working capital isn’t always inadequate. Walmart (WMT), for example, has leverage over its supplies for favorable payment terms, which translates to higher current liabilities versus current assets. Other examples are Verizon (VZ) and Southwest Airlines (LUV).
Also, higher working capital may not mean good things either. It could indicate that the company has too much inventory or is not reinvesting its cash.
Back to the formula, we can find all three items from Oshkosh Corp’s balance sheet.
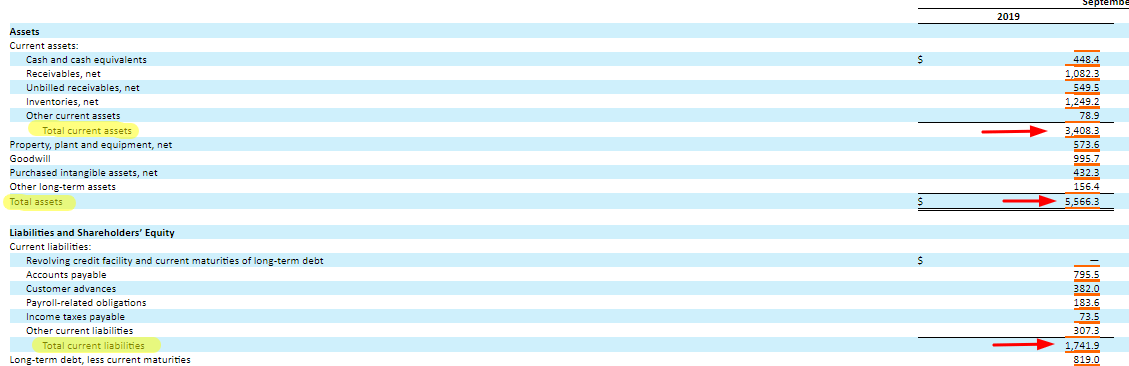
Pulling our numbers from the balance sheet:
- Current Assets – $3,408.3
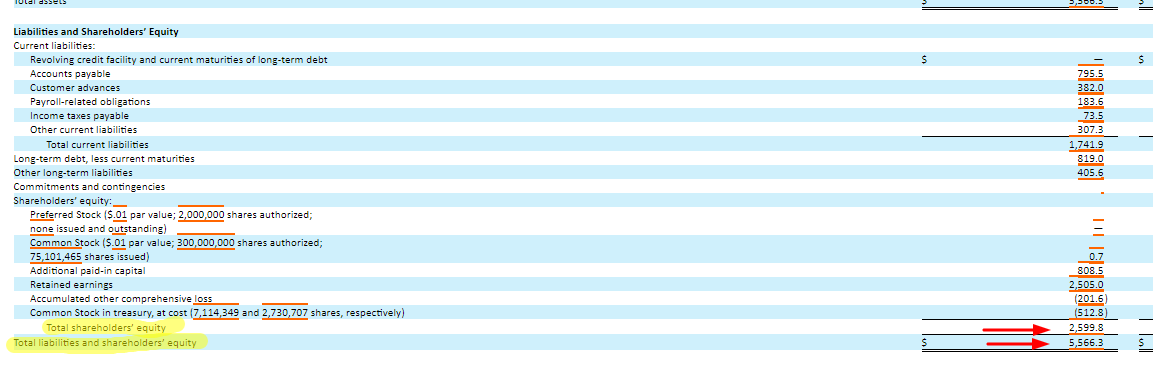
- Current Liabilities – $1,741.9
- Total Assets – $5,566.3
Plugging all the numbers into our formula, we get:
X1 = ( 3408.3 – 1741.9 ) / 5566.3
X1 = 0.29
Altman X2
We are moving on to the next portion of our formula.
Altman X2= Retained earnings / Total Assets.
Remember that retained earnings are the percentage of net earnings not paid out for dividends or share repurchases. When we combine it with total assets, the purpose of the ratio is to relay to us how much the company relies on debt.
Logically, this makes sense when you think about it. If a company has little or no retained earnings, it must raise funds to operate it from somewhere. The lower the ratio, the more a company funds assets by debt instead of retained earnings.
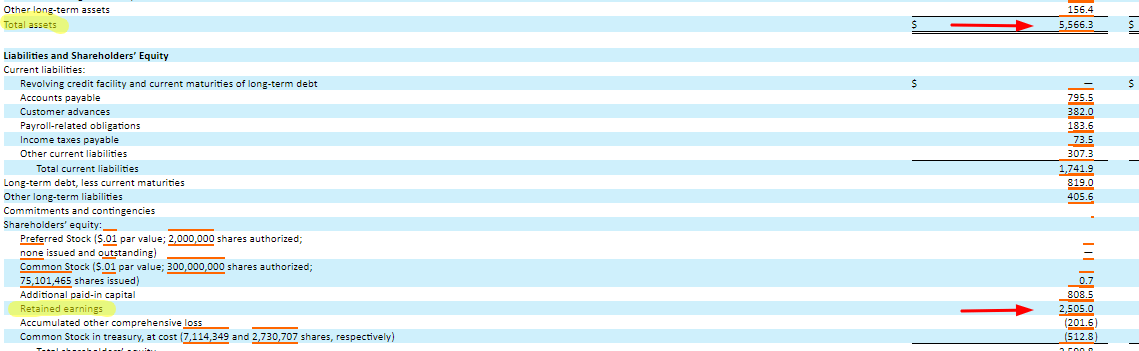
Pulling numbers from the above balance sheet:
- Total Assets – $5,566.3
- Retained Earnings – $2,505
Plugging everything into the formula:
X2= 2505 / 5566.3
X2 = 0.45
Altman X3
Altman X3 = EBIT / Total Assets
The above formula might look vaguely familiar, but it reminds me of Return on Assets, which is net income divided by total assets. The only difference is that earnings before interest and taxes are the numerator instead of net income.
It all amounts to the same result; the ratio looks at Oshkosh’s ability to generate profits from its assets.
To calculate this formula, we will use numbers from the income statement and balance sheet. Since we have already used the total assets twice, I will not use that balance sheet again.
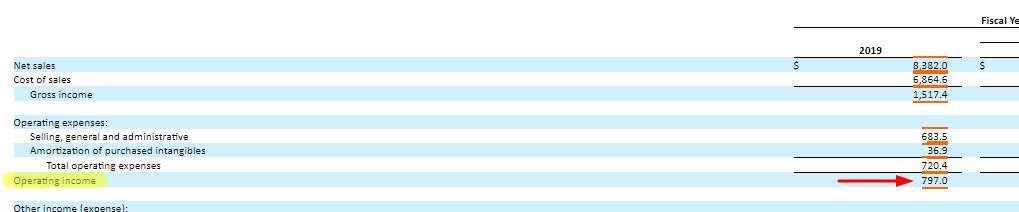
EBIT from Oshkosh’s income statement equals:
- $797
Plugging in our numbers for the formula:
X3 = 797 / 5566.3
X3 = 0.143
On to the next section of the formula.
Altman X4
X4 = Market Value of Equity / Total Liabilities
This is one of the more controversial sections of the formula because as the company’s price increases, so does the market value of the equity, and price does not always indicate the strength of financials.
Exhibit A would be Tesla (TSLA); by all financial measures, Tesla is a train wreck, but currently, its market cap is astronomical because of the company’s cult-like following, not because it is making any money, which it is not.
Companies with a negative PE ratio can have a healthy number in this ratio solely because of their popularity and high price points.
Let’s examine Oshkosh Corp’s current market cap and balance sheet for its total liabilities.
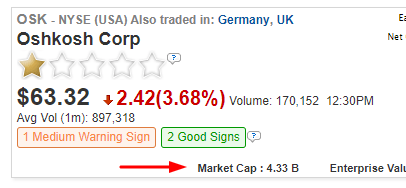
Pulling our numbers from the balance sheet:
- Market Cap – $4.33B
- Total Liabilities – will we need to calculate the total liabilities by subtracting the total liabilities and shareholders’ equity from the shareholders’ equity?
- Total Liabilities = ( $5,566.3 – $2,599.8)
- Total Liabilities = $2,966.5
Now, we can plug all of our numbers into the formula.
X4 = 4330 / 2966.5
X4 = 1.46
Altman X5
We move on to the final component of our formula.
X5 = Net Sales / Total Assets
The above ratio indicates asset turnover and looks at the dollar of sales the company generates for every dollar of assets.
The more money we can generate from assets, the more we like the company.
The ratio is also a great indicator of the efficiency and quality of the business and is best used to compare to the previous year.
It is pulling again from the income statement for net sales, also known as net revenue.
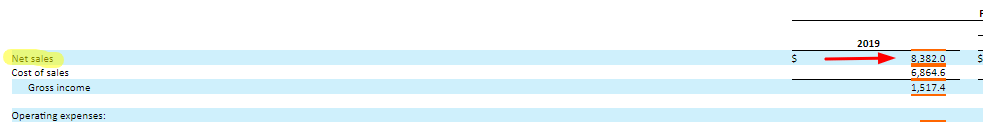
Our net sales from the income statement:
- $8382
We are using the total assets from the above balance sheet examples for the other ratios we have calculated.
X5 = 8382 / 5566.3
X5 = 1.51
Full Calculation
Okay, that wraps up our analysis of each component of the Altman Z-score. Now, let’s add all of our numbers to the formula, and we can see our results for Oshkosh Corp.
First, a refresher on the formula:
Z = 1.2*X1 + 1.4*X2 + 3.3*X3 + 0.6*X4 + 1*X5
Results from our calculations:
- X1 = 0.29
- X2 = 0.45
- X3 = 0.143
- X4 = 1.46
- X5 = 1.51
Let’s add our numbers to the formula and see what we get.
Z = 1.2*0.29 + 1.4*0.45 + 3.3*0.143 + 0.6*1.46 + 1*1.51
Z = 0.34 + 0.63 + 0.47 + 0.87 + 1.51
Z = 3.82
Ok, that wasn’t too hard. It looks pretty daunting when you start, but once you break down each formula component, you see it is straightforward.
Let’s look at a few more to help solidify how to utilize the formula best.
The next company I would like to examine is Caterpillar (CAT), a manufacturing company.
For this example, I will use the trailing twelve-month numbers or TTM to get the most recent number.
Here is a list of numbers pulled from the financial reports before we put together the ratios.
- Total Assets – $78,453 Mil.
- Total Current Assets – $39,193 Mil.
- Total Current Liabilities – $26,621 Mil.
- Retained Earnings – $34,437 Mil.
- EBIT – $7,812 Mil.
- Revenue – $53,800 Mil.
- Market Cap – $62,946 Mil.
- Total Liabilities – $63,824 Mil.
X1 = ( Current Assets – Current Liabilities ) / Total Assets
X1 = 39193 – 26621 / 78453
X1 = 0.16
X2 = Retained Earnings / Total Assets
X2 = 34437 / 78453
X2 = 0.44
X3 = EBIT / Total Assets
X3 = 7812 / 78453
X3 = 0.10
X4 = Market Value of Equity / Total Liabilities
X4 = 62496 / 63824
X4 = 0.98
X5 = Revenue / Total Assets
X5 = 53800 / 78453
X5 = 0.68
Now, let’s add all the ratios to our formula.
Z = 1.2*0.16 + 1.4*0.44 + 3.3*0.10 + 0.6*0.98 + 1*0.68
Z = 0.19 + 0.62 + 0.33 + 0.58 + 0.68
Z = 2.37
Ok, that was interesting; one more for giggles.
Let’s try Boeing (BA), which has been in the news a lot lately because of its financial trouble and the aggressive share repurchases it initiated before the financial crisis.
Here are the numbers from the financials; again, I will use the TTM or trailing twelve-month numbers. This time, I will show the ratio calculation results, as I know you can all do the math.
Boeing TTM numbers:
- Total Assets – $133,625 Mil.
- Total Current Assets – $102,229 Mil.
- Total Current Liabilities – $97,312 Mil.
- Retained Earnings – $50,644 Mil.
- EBIT – -$2,259 Mil.
- Revenue – $76,559 Mil.
- Market Cap – $83,415 Mil.
- Total Liabilities – $141,925 Mil.
Ok, now for the calculations for our Altman Z-score.
Z = 1.2*0.036 + 1.4*0.379 + 3.3*-0.01 + 0.6*0.59 + 1*0.57
Z = 0.04 + 0.53 + -0.03 + 0.35 + 0.57
Z = 1.46
Ok, that is interesting, and that wraps up our calculation section of the Altman Z-score.
Let’s move on and discuss what the results tell us about the companies we just analyzed.
What is a Good Altman Z-Score?
Before we get into the results of our calculations, let’s review our scores for each company.
- Oshkosh Corp – 3.82
- Caterpillar – 2.37
- Boeing – 1.46
There are rules for interpreting the Altman Z-score:
- When Z is equal to or greater than 3.0, the company is safe
- When Z is between 1.81 and 2.99, it is in the Grey Zone
- When Z is less than 1.81, it is in the Distressed Zone
Looking at our above three companies, we could assign the following to each:
- Oshkosh Corp is in the safe zone
- Caterpillar is in the grey zone
- Boeing is in the distressed zone
This coincides with the market’s perception of the strength of all three of these companies.
From the perspective of bond ratings and the Altman Z-score, we can get a correlation of companies’ creditworthiness.
Here is the reference to bond ratings and the Z-score:
- AAA/AA 4.13
- A 4.00
- BBB 3.01
- BB 2.69
- B 1.66
- CCC/CC 0.23
- D 0.01
According to the numbers above, Oshkosh would have a credit rating between BBB and A, Caterpillar would have a credit rating between B and BB, and Boeing would be between B and CCC.
Using this score to give us a quick reference to the credit ratings of the companies is very useful in assessing the financial strength of any company.
For reference, any company below BBB is considered a high-risk bond, otherwise known as a junk bond, and above BBB is corporate bond strength.
Final Thoughts
The Altman Z-score is a little under the radar regarding formulas; it is not a familiar one and has dwindled in use over the years. It still has value as an easy way to assess the credit quality of a company, plus it gives you an overall picture by calculating each ratio of the financial strength of each company.
As you work through the calculations, you will see which companies have greater balance sheet strength and utilize their assets to create revenue than the companies that are struggling in those areas.
The formula looks daunting, but as we have seen, once you break down the parts, it becomes easy to perform. The biggest trick is knowing where to find each piece of data; once you know it, it is a breeze.
That is going to wrap up our discussion of the Altman Z-score today.
As always, thank you for taking the time to read this post, and I hope you find something of value on your investing journey.
If I can further assist, please don’t hesitate to reach out; I am here to help.
Until next time.
Take care and be safe out there,
Dave

Dave Ahern
Dave, a self-taught investor, empowers investors to start investing by demystifying the stock market.
