Using ratios for analysis is a time-honored tradition in finance. These ratios can help you compare your company and your performance to others in your industry. Ratio analysis combines all sections of the financial statements and can give you a great company overview.
Calculating these ratios is fairly simple once you know which ones to use and where to find the data. Some industries, such as banking and insurance, will have ratios particular to their industry.
In today’s post, we will discuss:
- What is Ratio Analysis?
- What Does Ratio Analysis Tell Us?
- Ratio Analysis Formulas
- Examples of Ratio Analysis In Action
- Ratios Across Sectors
Ok, let’s dive in.
What is Ratio Analysis?
According to Investopedia:
“Ratio analysis is a quantitative method of gaining insight into a company’s liquidity, operational efficiency, and profitability by studying its financial statements such as the balance sheet and income statement. Ratio analysis is a cornerstone of fundamental equity analysis.”

We can see the importance of ratio analysis in comparing line-item detail from a company’s financials to unlock insights into profitability, liquidity, solvency, and operational efficiency.
Ratio analysis can tell us how a company is doing over time while revealing how one company compares to another in the same industry.
Comparing ratios outside of industries is not advised, as it doesn’t convey an apples-to-apples comparison. Comparing the profitability of Walmart to Apple doesn’t offer a reasonable comparison as they operate in different industries and have different costs of doing business.
While using ratios, it is important to relate them to other metrics to help give you an overall picture of a company’s financial health.
What Does Ratio Analysis Tell Us?
Analysts and investors utilize ratio analysis to scrutinize the financial health of companies by scouring past and present financial documents.
Using comparative data, we can demonstrate how a company performs over time and use the ratios to determine the possible future performance.
Using the ratio analysis data can help compare the company’s financial performance to others in the same industry and see how they stack up performance-wise.

Investors of all levels can use ratio analysis easily. We can find all the data required to calculate the ratios on all three financial documents.
The best part of ratio analysis is it acts as a comparison point for companies. For example, comparing P/E ratios of companies is a common point of reference for investors. Another plus is comparing the company’s performance to annual or quarterly reports.
We also must understand the different variables that drive these ratios and management’s ability to alter the strategies that can make these ratios more attractive to Wall Street.
Generally, these ratios are not used in isolation but rather concerning other metrics to tell a story. Having a good understanding of the ratios and the variables that move them is key to understanding the company’s financial health. Plus, understanding will help you identify possible red flags and help you avoid mistakes.
Ok, let’s take a look at some ratios.
Ratio Analysis Formulas
We can group the financial ratios into six categories based on their data.
Let’s walk through the metrics using a company to give us an idea of where and how to calculate the metrics. Most of these are simple ratios to calculate; the trick is to know where to look.
I want to use Google (GOOG), the search giant with a market cap of $1.284T and a current price of $99.48.
1. Liquidity Ratios – These ratios measure a company’s ability to pay off its short-term liabilities using its current or quick assets as the debt comes due. Ratios associated with liquidity are the Current Ratio and Quick Ratio.
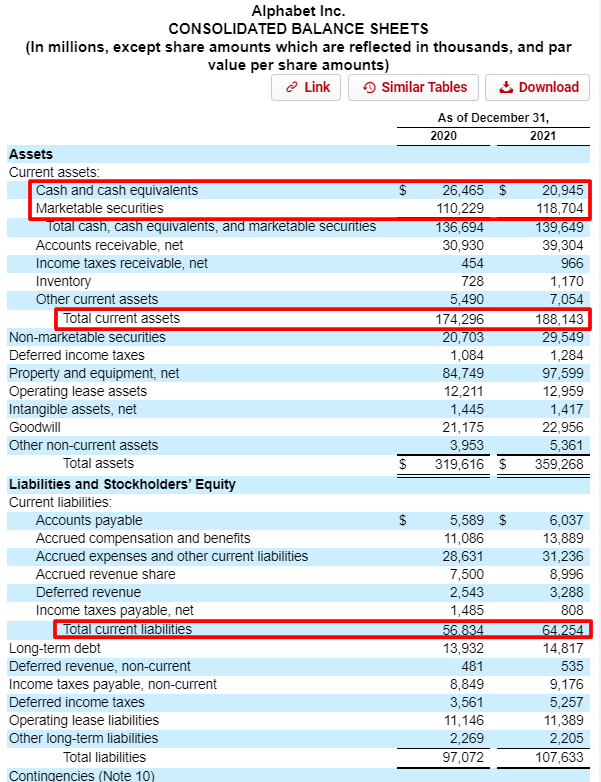
I am pulling the data from the above balance sheets for the liquidity ratios.
- Total Current Assets – $188,143 million
- Cash & Cash Equivalents – $20,945 million
- Accounts Receivables – $39,304 million
- Total Current Liabilities – $65,254 million
Now we can calculate our ratios for liquidity.
Current Ratio = Total Current Assets / Total Current Liabilities
Current Ratio = 188,143 / 65,254
Current Ratio = 2.88
Quick Rato = Cash & Cash Equivalents + Marketable Securities + Account Receivables / Total Current Liabilities
Quick Ratio = 20,945 + 118,704 + 39,304 / 65,254
Quick Ratio = 2.74
2. Solvency Ratios – Also referred to as financial leverage ratios. The solvency ratios compare a company’s debt load to its assets, equity, and earnings. We can use them to evaluate the likelihood of a company surviving over the long haul. They measure the ability to pay interest on the debt and pay off the long-term debt. Three ratios are associated with solvency: debt-to-equity, debt-to-assets, and interest coverage.
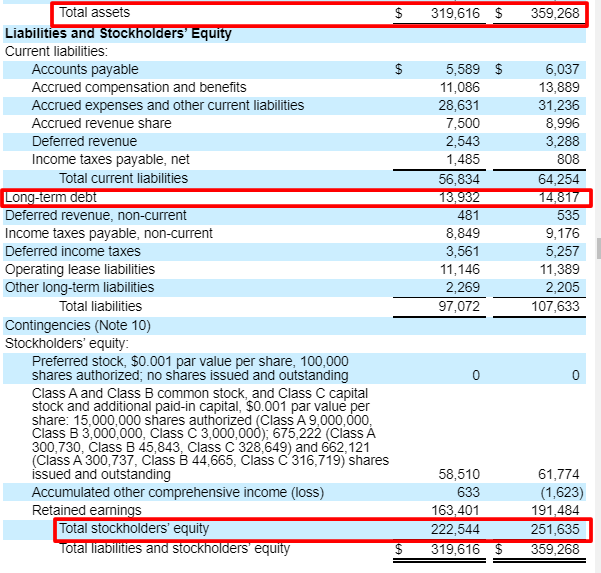
Pulling the highlighted data from the balance sheet and the income statement, we can calculate our solvency ratios.
- Short-term debt – $0
- Long-term debt – $14,817
- Shareholders Equity – $251,635
- Total Assets – $359,268
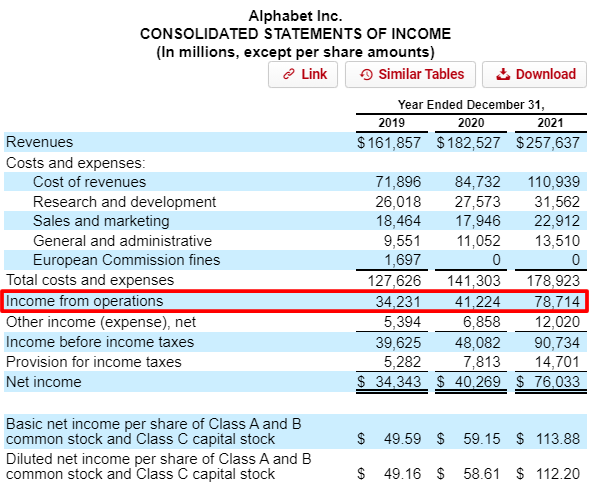
- EBIT or Operating Income before Taxes – $78,714
- Interest Expense – $346
Ok, now we can calculate our ratios for solvency.
Debt-to-Equity = Short-term debt + Long-term debt / Shareholders Equity
Debt-to-Equiy = 0 + 14,817 / 251,635
Debt-to-Equity = 0.06
Debt-to-Assets = Short-term Debt + Long-term Debt / Total Assets
Debt-to-Assets = 0 + 14,817 / 359,268
Debt-to-Assets = 0.04
Interest Coverage Ratio = EBIT / Interest Expense
Interest Coverage Ratio = 78,714 / 346
Interest Coverage Ratio = 227.4
3. Profitability Ratios – These ratios tell us how well a company can profit from its operations. These ratios include net profit margin, return on assets, return on equity, gross profit margin, and operating profit ratio.
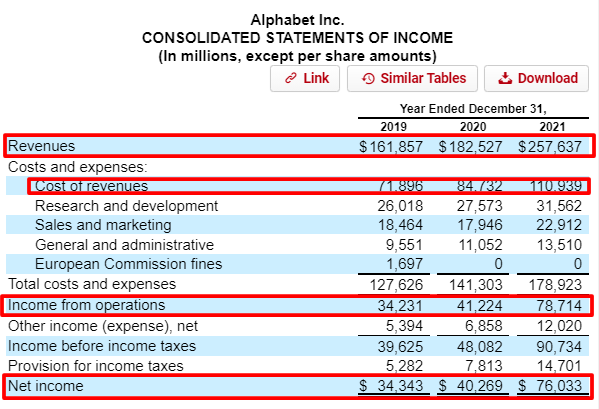
I am pulling the highlighted data from the above income statement and balance sheets.
- Total Revenue – $257,637
- Costs of revenues – $110,939
- EBIT or Operating Income – $78,714
- Net Income or Earnings – $76,033
Average total assets = $339,442
Average shareholders’ equity – $237,090
Ok, let’s start putting together our ratios for profitability.
Gross Profit Ratio = Gross Profit / Net Revenue
To find the Gross Profit, we need to subtract the costs of goods sold from the total revenue.
Gross Profit = $257,637 – $110,939 / $257,637
Gross Profit Ratio = 146,698 / 257,637
Gross Profit Ratio = 56.94%
Net Profit Ratio = Net Profit / Net Revenue
Net Profit Ratio = 76,033 / 257,637
Net Profit Ratio = 29.51%
Operating Profit Ratio = Operating Revenue / Net Revenue
Operating Profit Ratio = 78,714 / 257,637
Operating Profit Ratio = 30.55%
Return on Equity = Net Profit / Average Shareholders’ Equity
Return on Equity = 76,033 / 237,090
Return on Equity = 32.06%
Return on Assets = Net Profit / Average Total Assets
Return on Assets = 76,033 / 339,442
Return on Assets = 22.40%
4. Efficiency Ratios – Also referred to as activity ratios, efficiency ratios measure how efficiently a company uses its assets and liabilities to create sales and maximize its profit. Some key efficiency ratios to consider are asset turnover, receivables turnover, and days sales outstanding. There are others to consider, such as inventory turnover, which does not apply to Google.
We are pulling our data as before from the sections of the income statement and balance sheet.
- Revenue – $257,637 million
- Total Assets 2020 – $319,616 million
- Total Assets 2021 – $359,268 million
- Receivables 2020 – $30,930 million
- Receivables 2021 – $39,304 million
Now we can calculate our efficiency ratios for Google.
Asset Turnover = Net Revenue / (( Total Assets 2020 + Total Assets 2021 ) / 2)
Asset Turnover = 257,637 / ((319,616 + 359,268) /2)
Asset Turnover = 257,637 / 339,442
Asset Turnover = 0.76
Receivables Turnover = Net Revnue / (( Accounts Receivables 2020 + Accounts Receivables 2021 )/2)
Receivables Turnover = 257,637 / (( 30,930 + 39,304 )/2)
Receivables Turnover = 257,637 / 35,117
Receivables Turnover = 7.34
Days Sales Outstanding = Accounts Receivable / Revenue * Days in Period
Days Sales Outstanding = 39,304 / 257,637 * 365
Days Sales Outstanding = 46.12
5. Earnings Ratios – Finally, some ratios that everyone is familiar with. These ratios are some of the most used in finance, and you are likely familiar with many of them. Investors use these to predict future earnings and future performance. The ratios include the P/E ratio, dividend yield, earnings per share (EPS), and dividend payout ratio.
Pulling the below info from our favorite financial website, we get:
- Market price per share – $99.57
- Earnings per Share – $5.61
- Net Income – $76,033
- Shares Outstanding – 13,266
- Dividends Paid – $0
Now, we can put together our earnings ratios.
P/E Ratio = Market price per share / Earnings per share
P/E ratio = 99.57 / 5.61
P/E Ratio = 17.75
Earnings Per Share = Net Income / Shares Outstanding
Earnings Per Share = 76,033 / 13,266
Earnings Per Share = 5.73
Ok, that wraps up our foray into the list of ratios and how to calculate them. Now let’s put them to use to help us analyze a company.
The above examples for Google remain fairly simple to calculate and don’t tell us much by themselves. The ratios shine when comparing them to other companies.
Moving on to the next section, we will put them to use.
Examples of Ratio Analysis in Action
As we have seen from the above examples, calculating the different ratios is not complicated. The biggest challenge remains knowing which ratios to use and where to find the data.
We have several ways to use the data from ratios; one, we can compare them to others in the same industry. The other, we can use them as a reference against themselves. For example, looking at the net profit ratio of a company over a longer period can give you an idea of the long-term profitability of a company, which can give you an example of how the company will do long-term.
I want to use the data we just compiled and compare that to Microsoft, which is Google’s biggest competitor in the cloud, at least in the US.
We will compare the annual ratios for the last calendar year; I will not force you to endure all those calculations again. Rather, I will pull the data from our Google examples and calculate the ratios for Microsoft myself to make this a touch easier to view.
|
|
Microsoft | |
|
Current Ratio |
2.81 |
1.78 |
|
Quick Ratio |
2.78 |
1.75 |
|
Debt to Equity |
0.11 |
0.37 |
|
Debt to Assets |
0.08 |
0.17 |
|
Interest Coverage |
234.07 |
40.42 |
|
Gross Profit |
56.74% |
68.4% |
|
Operating Profit |
29.65% |
42.06% |
|
Net Profit |
25.89% |
36.39% |
|
Return on Equity |
28.96 |
46.42 |
|
Return on Assets |
20.53 |
21.16 |
|
Asset Turnover |
0.20 |
0.58 |
|
Day Sales Outstanding |
46.12 |
64.72 |
|
P/E Ratio |
18.47 |
25 |
|
EPS |
5.73 |
9.64 |
Ok, so what jumps out at you at first blush? The first couple of things I noticed is that Microsoft has a bit higher debt-to-equity ratio, which might indicate that they are carrying more debt than Google.
Also, it looks like Microsoft remains more profitable than Google, with much higher profit margins than Google. Another difference, we can see a lower P/E ratio for Google, which might indicate that Wall Street values the earnings of Microsoft more and pricing up the company.
See, now wasn’t that interesting? The above example offers a game we should play when analyzing a company. You don’t necessarily have to use all the above ratios, but comparing all areas of the financial statements is helpful.
We can use ratios to compare them across the years to give you an idea of any trends occurring within the company. Seeing them in isolation for only one year can cause a recency bias without putting the numbers in context.
Let’s look at Google using some of the above ratios over the years.
|
2018 |
2019 |
2020 |
2021 |
LTM | |
|
Current Ratio |
3.92 |
3.37 |
3.07 |
2.93 |
2.81 |
|
Quick Ratio |
3.89 |
3.35 |
2.41 |
2.17 |
2.04 |
|
Interest Coverage |
285.92 |
359.28 |
305.36 |
227.5 |
229.06 |
|
ROE |
18.62 |
18.12 |
19 |
32.07 |
28.96 |
|
ROA |
14.29 |
13.5 |
13.52 |
22.4 |
20.53 |
|
Gross Margin |
56.48% |
55.58% |
53.58% |
56.94% |
56.74% |
|
Operating Margin |
23.82% |
22.2% |
22.59% |
30.55% |
29.65% |
|
Net Margin |
22.46% |
21.22% |
22.06% |
29.51% |
25.89% |
A chart like the above is a good exercise to see trends in any ratios. Also, calculating a median over a long period provides an anchor for comparing the current year’s performance.
I used quickfs.net to pull together all the above data; it is easier than digging through all the old 10-K’s.
Charts like this offer a great way to understand the company’s trends. If you currently hold the company, paying closer attention in the coming years could prove worthwhile. And if you still want to invest in Google, then watching the upcoming quarters/annual reports will be necessary to get an idea of its continuing performance.
Ratios Across Sectors
We want to compare our ratios to other companies, ourselves over a longer horizon, and the industry we operate in.
To compare Google, we want to look at how the industry has performed across key metrics.
2021 Computer Programming Ratios – Whole Industry
- Debt to equity – 0.56
- Interest Coverage Ratio – (2.40)
- Current Ratio – 1.58
- Quick Ratio – 1.44
- Profit Margin – (8.6%)
- Return on Equity – (24.1%)
- Return on Assets – (5.9%)
- Gross Margin – 66.7
- Operating Margin – (7.2%)
- Asset Turnover – 674 days
- Dividend Payout Ratio – 0.24
Looking at data like the above remains useful because we can see how our company compares to its industry and whether they continue creating value for us.
The best place I found to compare ratios across industries is readyratios.com.
When calculating your ratios, I highly recommend looking at the industry ratios to give you an idea of how your company stacks up. Google and Microsoft continue outperforming the computer industry, providing helpful information.
Final Thoughts
Utilizing ratio analysis is a quick, easy way to determine the profitability, solvency, earnings power, and efficiency of any company you are investigating.
The ratios’ calculations are simple; the biggest issue is locating the data you need to calculate the numbers.
Using the ratios across industries and comparing them to longer time horizons and others in the same industry is the way to go. When reading through the financial statements, your eyes can swim a little because the numbers sometimes don’t have context. Ratio analysis can help put the numbers in context, bring them much more to life, and help you determine a profitable company.
That is going to wrap up today’s discussion of ratio analysis.
As always, thank you for taking the time to read the post, and I hope you find something of value on your investing journey.
If I can be of any further assistance, please don’t hesitate to reach out.
Until next time.
Take care and be safe out there,
Dave
