The DuPont model is a classic tool for any investors toolbox and many even consider it an essential part of any analysis. The DuPont Analysis equation breaks a company’s Return on Equity (ROE) down into three core elements; Profit Margin, Asset Turnover, and Financial Leverage.
As readers will come to learn, it is not enough to simply say that a company has a high ROE and therefore is a good business. The DuPont method teaches us that it is crucial to understand how the company achieved that ROE through dissecting its components.

The name for the method originates from its creation in 1912 by Donaldson Brown while he worked at DuPont. The formula’s strengths and mathematical precision give many accountants and financial analysts a strong admiration for the formula and its young creator.

This article will discuss the DuPont formula calculation and its interpretation as we use Dupont analysis on three high profile businesses operating across different industries as well as compare two different tire manufactures operating within the same industry.
The Beauty in the Dupont Analysis Numbers
The way the DuPont formula comes together is a beautiful thing. Below you will see how the formulae of three different financial metrics is reduced to the ROE formula itself. This is crucial because it allows one to analyze how a business is generating returns for shareholders; whether it be Profit Margin, Asset Turnover, and/or Financial Leverage.
Using the DuPont method, investors and management can isolate important similarities and differences between a business and the competition as well as establish how returns are being generated within a business across various segments and projects.
Let’s take a look at the breakdown and math behind the DuPont method analysis of ROE. As can be seen, when we lay out the detailed formulae for the three financial metrics of the DuPont method, and then cancel out like items in the numerator and denominator, we are then left with the ROE equation.

Analyzing the Components of a Dupont Analysis
As mentioned previously, a high ROE does not necessarily make one company better than another. Knowing and understanding what types of information can be learned about the business in question from the three component metrics of the DuPont model is where the value of the formula comes to shine.
Profit Margins: This common metric forms the base of the profitability analysis and shows how much worth of sales, as a percent, is able to flow down to shareholders. High profit margins can show many things such as efficient operations or a superior product and pricing power.
Asset Turnover: Costs associated with running the business can either be expensed through the income statement or can be capitalized and built up on the balance sheet. The inclusion of the asset turnover ratio is an inverse measure of how many years of sales it would take to purchase the asset base, if profit margins were 100%. For example, an asset turnover ratio of 2.5x would imply that it takes only 0.4 years of sales to purchase the company’s assets. (1/2.5 = 0.4 years). The higher the asset turnover ratio, the better, as it shows the company’s assets are productive and able to generate a lot of sales.
Financial Leverage: Financial leverage is a measure of how many times shareholder’s equity is being leveraged up in order to purchase the assets of the business. Asset heavy businesses with long cash flow durations tend to lend themselves to high financial leverage. Think about real estate with its constant cash flows and ability to get mortgage financing. Now apply the same thinking to asset heavy industries with cash regularities such as infrastructure, electricity providers, and waste & water. On the other hand, if financial leverage is being used too heavily in an effort to raise ROE and/or mask weak profitability, then businesses can get themselves into trouble with the added financial risk.
Looking Across Industry Giants
To help readers understand the differences of how a company can achieve returns for shareholders, we will first look across industries as we compare three well-known names; railroad operator Union Pacific, grocer and retailer Walmart, and software provider Microsoft.
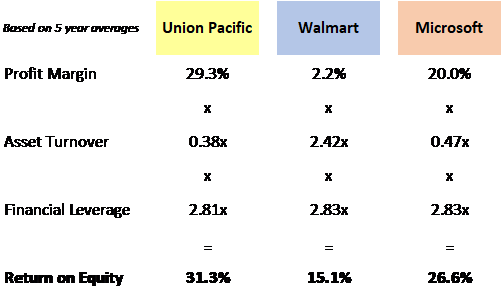
Union Pacific: The company’s high average profit margin of 29.3% over the past 5 years is achieved through the pricing power gained from their scare asset of continent-wide railway tracks. However, this asset costs a lot to build, acquire, and maintain which causes Union Pacific to have a large balance sheet. With only a 0.38x asset turnover, maintaining this large balance sheet has a diminishing effect on returns to shareholders. Fortunately though, a company with high profit margins and a valuable physical asset base can easily leverage those assets. Together with Union Pacific’s 2.81x financial leverage, the company is able to achieve a very strong ROE of 31.3%.
Walmart: Being a retailer and middle-man that prides itself on having the lowest prices, Walmart has razor-thin profit margins. However, such low margins are able to attract consumers and drive sales which helps Walmart turn their asset base over 2.42x each year on average. This high asset turnover makes up for the low profit margin and together with leveraging their asset base by a reasonable 2.83x helps achieve a respectable 15.1% ROE.
Microsoft: The universal Microsoft software suite provides the company with great net income margins of 20.0% over the past 5 years. Unfortunately, a lot of development is still needed to build and maintain their Microsoft suite of products and patent portfolio, let alone acquire newcomers in the space such as LinkedIn and build out new infrastructure for the cloud. This leaves Microsoft with a large asset base that only turns over 0.47x each year. Together with a modest leverage of 2.83x, the company is able to achieve a great 26.6% ROE.
Comparing within the Same Industry
Once one becomes familiar with what type of return structure to expect in which industry, we can start comparing competitors within the same industry.
Within the same industry, asset turnover ratios should be relatively the same if the business is depreciating/amortizing their assets appropriately and assuming their operations are running at capacity production/sales.
Let’s take a look at well-known tire manufacturers Michelin and Goodyear to see what we can discover.
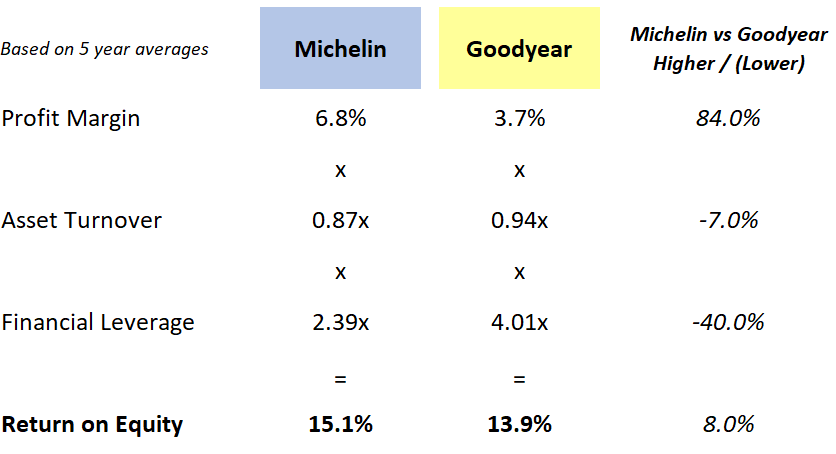
While Michelin and Goodyear have very similar 5-year average ROE at 15.1% and 13.9% respectively, they get there in two very different ways. First off, we see that Michelin’s profit margins are a significant 84% higher that Goodyear’s. This might show superior product or more efficient operations.
Next we see that the two company’s asset turnover ratios are relatively the same with Goodyear’s being stronger by only 7%. This could imply, for instance, that Goodyear is utilizing their capacity more or that Michelin is choosing to capitalize more expenses instead of running them thought the income statement where they would show up in profit marings.
Lastly, we see that Goodyear is significantly more financially leveraged at 4.01x and might be trying to play a bit of catch up.
Overall, this DuPont analysis makes it look like Michelin is the superior operating business with profit margins being 84% higher and it also shows that Goodyear is stretching themselves financially to try and return a respectable ROE to shareholders in line with the industry.
More investigation could be done by the curious analyst to learn more about these initial findings. One such analysis could be a time series analysis to see how the sources of each company’s profitability have changed over the past few years.
Takeaway
The DuPont method is an important tool that can be used to dissect a company’s profitability. It can be used to compare industry competitors and changes in the sources of a company’s profitability over a series of time. Investors should always remember though that a company with a high ROE is not necessarily a good investment at any price.
