The term degree of total leverage (DTL) is a measure of a company’s overall sensitivity in bottom-line net income to a change in sales. The metric captures the degree of operating leverage (DOL) and the degree of financial leverage (DFL) to measure the total degree of leverage at the company, as can be seen in the formula below. Understanding a company’s degree of total leverage is critical to help investors analyze the risk (and reward!) of a company.
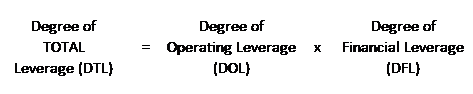
Besides combining these two formulas, the formula for DTL can also be calculated in its own right; as this article will discuss.
It is however important to note the distinction between what portion of total leverage is coming from operations and what portion is coming from the company’s capital structure. This article will discuss the logic and formulas behind the degree of total leverage metric while also using a real-life example (Walmart) to add some practicality for investors.
The Formula and Logic for Degree of Total Leverage
When most people think about leverage they think about the more common balance sheet metric financial leverage. However, the degree of total leverage is equally as important (if not more!) to understanding the risk of the business.
The DTL has to do entirely with the income statement and the formula can be read as “for each 1% change in sales, net income will change by X %”.
Just like with the other DOL and DFL metrics, ideally the DTL figure is based off sales, variable costs, fixed costs, and interest costs (including other financing costs such as preferred dividends or capital leases).
While these items can be approximated by line items on the financial statements, only internal managements know the exact cost patterns based on units or sales volume. That being said, analysts and investors can back into the per unit numbers by dissecting the income statement and volume figures provided in financial reports. Below are three formulas to calculate the DTL based on available information.
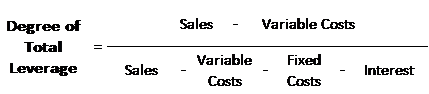
The first formula that can be used to calculate the DTL is an ideal formula which breaks costs down between variable, fixed, and interest. Looking at this formula, it will easily become noticeable that if fixed costs and interest costs are zero, then the degree of total leverage will be equal to 1 as the numerator and denominator will be the same.
The second formula that can be used to calculate the DTL is also ideal. It is still breaking down costs between variable, fixed, and interest but it now is also looking at revenues and costs on a per unit or volume basis.

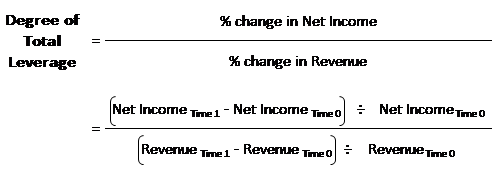
The third formula that can be used to calculate the DTL is not ideal, as it uses historical or forecasted results, but can still be a good approximation for external analysts and investors to gauge the impact of changes in revenue to prior year results or forecasts. It uses top-line revenue and bottom-line net income to analyze the degree to which net income changes based on changes in revenue.
The Degree of Total Leverage Changes with Sales
Being based on the income statement and not the balance sheet, the degree of total leverage is dynamic and will change with the level of sales. For the same business, the DTL changes with sales, as each incremental sale is more (or less) significant in terms of the fixed operating costs and interest expenses that are being leveraged.
This point is important for investors to understand because it will affect the rate at which net income changes throughout the business cycle of the company and as a company grows.
At a higher level of sales, the DTL will be LOWER because variable gross margins are already higher, which makes the amount of fixed operating costs and interest expenses being leveraged less significant.
On the opposite side, when a business has a lower level of sales in its current business environment the DTL will be HIGHER because each incremental sale is more significant in terms of the fixed operating costs and interest expenses that are being leveraged.
Example with Walmart’s Degree of Total Leverage
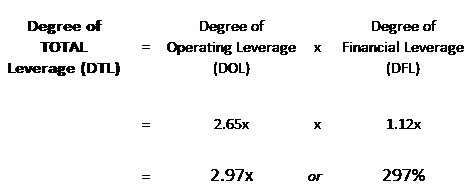
Continuing on with our Walmart example, the company’s degree of operating leverage was calculated as 2.65x and degree of financial leverage was 1.12x for the 2019 fiscal year. Since we have already calculated these leverage ratios in our previous lessons, we can use the first formula to calculate DTL by multiplying the two metrics together as can be seen below.
The calculated DTL of 2.97x means that for each 1% percentage change in sales, net income will increase by 2.97% (which is 2.97x or 297% of 1%). The other important item to note is the breakdown of Walmart’s leverage where we can see that the majority of leverage is operating leverage due to the high fixed costs involved in operating the business.
Takeaway
Knowing a company’s degree of total leverage is important to understand the risk and reward inherent in a company’s business model and capital structure.
The DTL can act as a guide to forecast net income’s sensitivity to changes in sales throughout a business cycle or as a company grows. It is also critical to appreciate the breakdown between operating leverage and financial leverage in order to understand where the sensitivity is coming from.
