A good deal about the health of a company can be learned from conducting balance sheet analysis and this article will go in depth on a few of the most important concepts such as liquidity metrics including working capital, the current ratio, quick ratio and also leverage metrics such as the debt-to-assets ratio and the equity multiplier.
From using these concepts, investors can analyze how much liquidity the company has to meet its short-term obligations and also how the company uses leverage to finance its assets.
Today, the balance sheet is professionally titled for financial reporting purposes the “statement of financial position” but the raw simplicity in the original name means that informally “balance sheet” is still most commonly used to refer to it in the workplace and everyday life. This raw simplicity lies in the fundamental accounting equation, also called the balance sheet equation, which states the sum of all assets must “balance” to the sum of all liabilities and equity in the business.
Assets = Liabilities + Equity
Assets and liabilities are broken down on the balance sheet into current, where cash will be paid or received within 1 year, and non-current, which are due beyond that 1 year period. Equity is long-term/indefinite in nature and is made up of shareholder capital contributed into the business plus any retained earnings (or minus any losses!) and also less any capital returned to shareholders through the form of dividends or shares repurchased.
Side Note: Equity has the potential to turn negative (called a deficit) on the balance sheet for both negative and positive reasons but the fundamental accounting equation will always balance. On the negative side, equity can be wiped out if losses in the business exceed the equity capital that has been contributed. On the positive side, equity deficits could also occur when capital contributed and income has been more than fully paid back to shareholders through dividends and share repurchases that, besides income, are financed by a wise use of debt and accounts payable liabilities. While the positive example is extremely rare, one such company to achieve this impressive feat is the highly profitable Autozone.
Balance Sheet Metrics
Now that introductions to the balance sheet are out of the way, let’s hop into the metrics and what they can tell us! Keep in mind that as always with any financial analysis, it is best practice not to just look at metrics at a specific point in time but also to analyze changes in a time series analysis. Also, financial metrics can vary significantly across different industries due to differences in business models and, as such, it is only relevant to compare companies in the same industry.
Working Capital
As a dollar figure measurement, the amount of working capital currently on hand can help us judge the company’s liquidity and ability to meet short-term obligations such as accounts payable, short-term borrowings, and accrued employee salaries, with current assets such as cash, accounts receivables, and inventories. In essence, the amount of working capital is current assets less current liabilities with a high positive number indicating financial health and liquidity and a negative amount indicating financial stress at the company that will likely lead to more borrowing.

Current Ratio
The current ratio is a liquidity measure that uses the same inputs as the working capital metric but now divides the current assets by the current liabilities to change the dollar amount into a ratio or percentage form. For this reason, the current ratio is also called the working capital ratio. Once again, this ratio can be used to judge the liquidity of the company and its ability to pay short-term liabilities with current assets. The higher the current ratio, the more healthy the company’s liquidity.

Quick Ratio
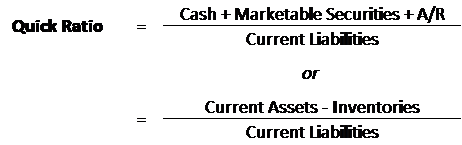
The quick ratio is a liquidity measure of the most liquid assets on the balance sheet such as cash, marketable securities, and accounts receivable (A/R) compared to the total current liabilities. The quick ratio is also called the acid test as it measures the company’s ability to quickly dissolve/liquidate its liabilities as could be done with acid. Notably, the quick ratio excludes inventories as these assets are less liquid and cannot be sold instantly. The fact inventories are not included leads to the second calculation method shown below which backs into the most liquid assets by subtracting inventories from current assets.
Debt-to-Assets Ratio
As we move deeper into the balance sheet with the debt-to-asset ratio we are now analyzing the overall leverage of the company and not just short-term liquidity. As a ratio in percentage terms, the debt-to-assets ratio measures the amount of assets that have been financed by creditors instead of equity capital. As such, the total debt in the equation should be all interest bearing debt payable to creditors and is not to be confused with total liabilities from the balance sheet.

Financial Leverage Ratio (Equity Multiplier)
The financial leverage ratio, also called the equity multiplier, is another metric that can shed light on the financial risk of the company as it shows how many times equity has been leveraged with liabilities in order to afford the assets on the balance sheet. The name equity multiplier comes from the fact that the ratio shows the amount which equity needs to be multiplied by in order to reach the total assets of the company.

The output signifies how much liabilities there are in the company compared to equity. If the ratio is 1 (100%), this means that liabilities and equity are equal in the capital structure. If the ratio is 2 (200%), this means that liabilities are 2x higher (200%) of the equity in the capital structure. It is important to note that the liabilities being implied by the financial leverage ratio are the total liabilities of the company which include more than just interest bearing debt.
Trade-off between Risk and Return
Comparing debt-to-asset and financial leverage ratios between industry competitors can tell a good deal about who is being most aggressive in the use of financial leverage to boost returns on equity as explained through the DuPont Analysis method to calculate return on equity. Ultimately, the amount of debt that a business can support depends on the profitability of the business and the interest rates at which it can borrow from creditors. As such, an important part of assessing the financial risk of a business involves an analysis of interest coverage ratios.
