Debt is a powerful tool a company can use to help leverage return on assets but it needs to be used responsibly. While debt-to-asset ratios tell a good deal to investors, they can be a bit deceiving because they mention nothing about the profitability of the business and ability to service the debt.
Enter coverage ratios (also commonly referred to as debt-service coverage) which investors can use to help determine how tight a company is towing the line in terms of fixed payments. The higher the coverage ratio, the better, as it shows the company has a greater safety net to pay interest payments and other fixed obligations if times get tough.

This article will go through some of the main types of interest coverage ratios, such as operating income, free cash flows from operations, and EBITDA. We will also touch on the nuances of being sure to include fixed obligations such as operating leases into the coverage calculation as we look at two companies, retail behemoth Walmart, and auto supplier giant Magna International.
Coverage Ratios – As can be seen in the various formulae below, to get an coverage ratio, one needs to look at how well operating income, before any fixed expenses, can cover the same mandatory cash expenses that are being added back to the operating income measure. As the calculation concerns fulfilling obligation, interest coverage ratios can also be referred to as debt service coverage as previously mentioned. Let’s dive into some of the different methods now.
- Interest Coverage Ratio: To start off, this is the simplest coverage ratio as everything can be found on the income statement. We start with net operating income and then divide by interest expense. Because of its simplicity and availability of information on the face of the financial statements, the interest only coverage ratio is probably the most common coverage ratios you will see stated on websites databases as Morningstar.

The big con with this method is if the company uses a lot of leases these are included within operating income and are not being taken into account for the fixed obligations if we are only looking at interest. If leases are a big part of the business model than these obligatory payments should be included in the coverage ratio.
- Interest and Rent Coverage Ratio: When material, it is proper to include another major fixed obligation in the form of the rent or lease payments. Rent or lease payments can make up a lot of a company’s fixed operating budget in the retail, airline, and even industrial manufacturing industries. As rent costs are included within operating income, they first need to be added back in the numerator before dividing by interest plus rent expenses in the denominator as can be seen in the formula below.

Side Note: There could be good reasons to add in other mandatory obligation, such as pension expense. As long as the expense is not variable with sales it could be considered for addition to an adjusted coverage ratio. An example of a contractual payment that would not be appropriate to include would be a royalty payment per unit which would be variable to sales and included in cost of goods sold and operating income.
- Free Cash Flow Coverage Ratio: Looking at depreciation expense on the income statement might be underestimating the true cost of replacing the aging asset. The free cash flow coverage ratio is probably one that management looks at on an internal basis when coming up with the company’s operating budget for the next year. For investors, we can look at free cash flows by adding back depreciation to operating income and then subtracting maintenance capital expenditures instead.

- EBITDA(R) Coverage Ratio: An interest coverage ratio based on EBITDA is exactly how it sounds with the company’s earnings before interest, taxes, depreciation, and amortization taking the place of operating income. For companies with rent payments as part of their business model, we can make the figure EBITDA”R” by adding rent expenses back as well.

The main con of the EBITDA to interest coverage ratio is that while depreciation is not a cash entry per-say, a sustainable business needs to spend money on capital expenditures and if we do not include depreciation or any charge to represent these capital expenditures than we would be inflating the cash available to service interest and rent payments. As such, EBITDA coverage ratios tend to be more popular in the loan business where lenders are more concerned about getting their principal repaid rather than the long-term viability of the business model.
Accounting Note on Coverage Ratios: Under the new IFRS 16 and ASC 842 all leases will need to be reported as right-to-use assets and liabilities on the balance sheet and depreciated over the life of the asset. While these new accounting standard put everyone more on the same playing field in terms of reporting liabilities and assets on the balance sheet (no more material off-balance sheet operating leases!), there still needs to cash flow adjustments for what is flowing through the income statement. A present value calculation always makes interest charges the highest at the beginning of the cash flow stream which in this case is the cash payments of the lease agreement. This means that if the company has more new leases on the books, then depreciation of the new right-to-use asset will probably be higher than the actual cash payments each year that used to be reported on the income statement when it was an operating lease.
A Tale of Two Companies – Walmart & Magna
For an example to get more comfortable with calculating coverage ratios across different industries, we will look at Walmart from the retail industry and Magna from the manufacturing industry. Both companies are exposed to rent expenses through their retail footprint and manufacturing facilities. Searching through their latest annual reports, we can see that Walmart had rent expense $3,004 million and Magna $361 million in their latest fiscal years. Using the face of their financial statements and these additional rent expenses, let’s calculate the coverage ratios of both companies.
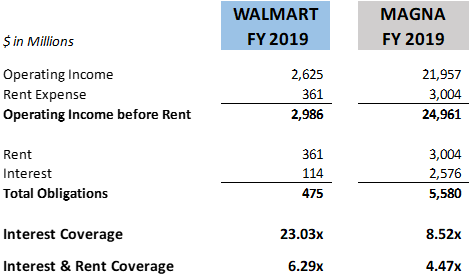
Sourced from Morningstar as well as Walmart and Magna financial statements.
Side Note: Investors and analyst can generally find rent or lease expenses in the footnotes to the financial statements when they talk about obligations or if not in the MD&A. My tips when searching for them would be to use the CTRL + Find search when in the financial report to search for words like rent expense, lease expense, lease obligation, etc.
As we can see, including rent expenses in the coverage ratio leads to very different results for both Walmart and Magna. Walmart’s interest coverage was 8.52x for their fiscal year 2019 but when rent payments are included, this drops down to 4.47x. For Magna, interest coverage was 23.03x in fiscal year 2018 but a more risky 6.29x when including rent expense. As many financial information websites simply report the interest coverage ratio, it is important for investors to take the time and include rent in the coverage ratio calculation when it is a material part of the business model. The big differences seen in this example should demonstrate this importance.
