Cash is king, and finding companies that are superior reinvestors of that cash is one of the trifectas of winning in investing. One of the easiest ways to find these companies is a formula called Cash Return on Invested Capital.
The CROIC formula is a bit of an inside-baseball kind of formula. Wall Street doesn’t talk about free cash flow as the focus as much, more on earnings that free cash flow and the uses of that cash.
Free cash flow is the source of reinvestment, not only in the business but also provides sources of cashback to us in the form of dividends or share repurchases.
From Warren Buffett:
“To invest successfully over a lifetime does not require a stratospheric IQ, unusual business insights, or inside information. What’s needed is a sound intellectual framework for making decisions and the ability to keep emotions from corroding that framework.”
In today’s post, we will discuss:
- What is Cash Return on Invested Capital?
- The Formula for Cash Return on Invested Capital
- How to Calculate Cash Return on Invested Capital with Examples
Ok, let’s dive in and find out how this formula works.
What is Cash Return on Invested Capital?
According to Investopedia:
“Cash return on capital invested (CROCI) is a formula for valuation that compares a company’s cash return to its equity. Developed by the Deutsche Bank’s global valuation group, CROCI gives analysts a cash flow-based metric for evaluating a company’s earnings.
CROCI is also referred to as “cash return on cash invested.”
If you are interested in reading the paper from Deutsche Bank, please click:
CROCI: A Real Value Investment Process
Basically, cash return on invested capital measures the cash a company generates compared to the equity required to create the cash.
It measures the operating profit a company earns compared to the total equity of the company, including both common shares and preferred shares of equity.
The CROIC formula shows you how much free cash flow per dollar the company creates from invested capital, which includes both equity and debt to create that cash flow.
The thing I like about this metric is it helps highlight companies that are effective with their cash and illustrates the strength of the business.
As with most metrics, the higher the number, the better, we are looking for companies that generate high returns on the cash it produces.
If you feel adventurous, you can substitute free cash flow for Buffett’s owner earnings, which is essentially the same idea from Buffett’s point of view.
You will find some formula online, which includes EBITDA as the numerator. Still, I stay away from the metric as it includes items that really should subtract from cash flow, such as depreciation, which in my mind is certainly a cash expense, but that is a whole other can of worms we can tackle at another time.
Ok, let’s jump in and look at the formula for cash return on invested capital.
Cash Return on Invested Capital Formula
The formula for a cash return on invested capital is similar to return on invested capital except that it focuses on the free cash flow of the company and more on the equity and debt-financed capital.
We talk a lot about debt and the many bad outcomes that too much debt can cause, but debt also drives a lot of returns as it allows companies to use those funds to reinvest back in the business.
The formula for CROIC is:
CROIC = FCF / Invested Capital
Ok, le’ ts break those parts down a little bit to make it a little more palatable.
Defining the numerator of the formula, we see the free cash flow and the breaks out as:
NOPAT = Net operating profit after Tax
That mouthful actually means operating income multiplied by the current tax rate of the company.
Free Cash Flow = Operating Income x (1-Tax Rate)
Ok, so that is pretty easy.
Now, the denominator up next.
Invested Capital includes items such as shareholders equity, short-term debt, and long-term debt, or:
Invested Capital = Shareholders’ Equity + Short-term Debt + Long-term Debt
As we work through these calculations, I will pull from the annual reports so you can see where the numbers come from that we will use in the formulas. Keep in mind that each company might list these items slightly differently on each financial report. Until the day arrive that the accounting standards require companies to list all short-term debt as such, we might have to try to interpret a little from time to time.
The hard sometimes is what makes it fun; if it were easy, then everyone would want to invest.
Ok, let’s dive in a examine a few companies and determine their cash return on invested capital ratios.
A note about doing these calculations, again, this is a bit of inside baseball formula so that it won’t be listed on a lot of financial websites, so it is a great one to be able to calculate it yourself.
And the bonus of the extra work is that it is not difficult to calculate once you know where to gather the data.
How Do you Calculate Cash Return on Invested Capital?
The first company I would like to analyze is Disney (DIS). Disney is one of my favorite companies to analyze because its financial reports are fairly straight forward, and they are transparent about its numbers, which makes our job a little easier.
Ok, so breaking the formula into parts we are going to look at two of the three financial reports to find our numbers, the income statement and the balance sheet.
Pulling up sec.gov and finding the latest 10-k for Disney, we will find both of those reports and highlight the data we need to calculate our formula.
A note before moving on, to calculate the tax rate for Disney, we are going to need two numbers, income taxes and income from continuing operations or operating income. To calculate the current tax rate for Disney, we use the following formula.
Tax Rate = Income Taxes / Operating Income before Taxes
To calculate operating income, we need to do a little calculation as well.
Operating income = Revenues – Total Costs and Expenses
Ok, I will now grab a screenshot of the income statement for Disney and highlight the line items we need our numbers.
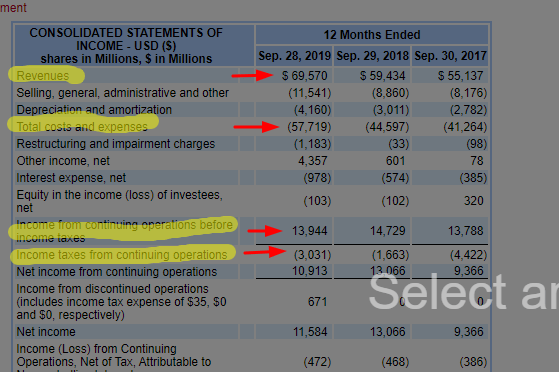
Pulling the numbers from the above income statement we get:
- Revenues – $69,570
- Total Costs and Expenses – $(57,719)
- Income Taxes – $3,031
- Income Before Income Taxes – $13,944
To calculate the free cash flow for Disney, we can first calculate the tax rate that Disney paid for the year ending in 2019.
Tax Rate = Income taxes / Operating Income
Tax Rate = $3,031 / $13,944
Tax Rate = 21.73%
To find the operating income, we pull the numbers from above.
Operating income = Revenue – Total costs and expenses
Operating income = $69,570 – $57,719
Operating income = $11,851
Then we take the tax rate and plug that into the free cash flow formula from above.
Free Cash Flow = Operating income x (1- Tax Rate)
Free Cash Flow = $11,851 x ( 1 – .2173 )
Free Cash Flow = $11,851 x ( .7827)
Free Cash Flow = $9,275.78
Now for the denominator of our formula, we need to go to the balance sheet to gather our other numbers. I will highlight the items need for the next calculations.
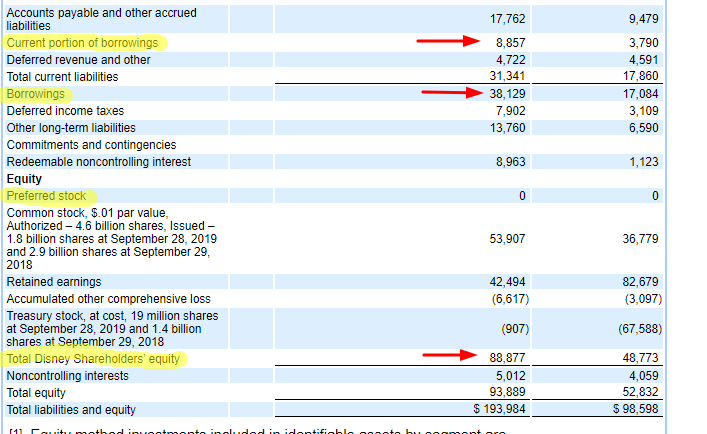
Ok, so pulling the numbers from the above balance sheet:
- Short-term Debt (Current portion of borrowings) – $8,857
- Long-term Debt (Borrowings) – $38,129
- Total Shareholders’ Equity – $88,877
As you can see from Disney’s balance sheet, they don’t outright state that those line items are short-term or long-term debt, but we can infer from common sense what those terms mean, unfortunately, as I stated before there is no common thread for the naming of different line items so sometimes you will have to use logic to figure it out.
I have faith you can do it, I believe in you!
To calculate the invested capital portion of the formula we:
Invested Capital = Short-term debt + Long-term debt + Total Shareholders’ Equity
Invested Capital = $8,857 + $38,129 + $88,877
Invested Capital = $135,863
Now, let’s put together the two parts of the formula we calculated.
CROIC = Free Cash Flow / Invested Capital
CROIC = $9,278.78 / $135,863
CROIC = 6.82%
Now, wasn’t that easy? As for the result, it is a little disappointing. I would ideally like to find a company that has a CROIC of above 10%.
Ok, let’s try another, shall we? How about Visa (V) this time?
I will pull up the financials and highlight the line items we will need to calculate our formula for CROIC.
Now we will pull our numbers from the above financial statements to find the CROIC for Visa.
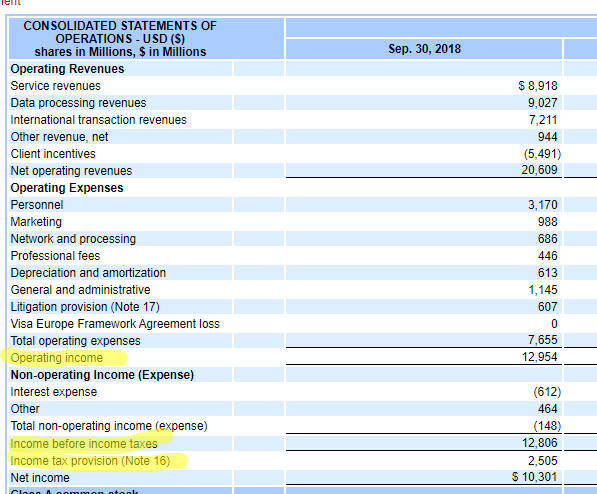
One thing I wanted to point out, notice how Visa lists the line items more clearly than Disney does? You can see the operating income without having to calculate the numbers; also, the long-term and short-term debts are listed clearly. These illustrate the point I was trying to make earlier that there is no uniform method to listing each line item and can make it a touch more confusing.
The numbers for our formula are:
- Operating income – $12,594
- Income Taxes – $2,505
- Income before Income Taxes – $12,806
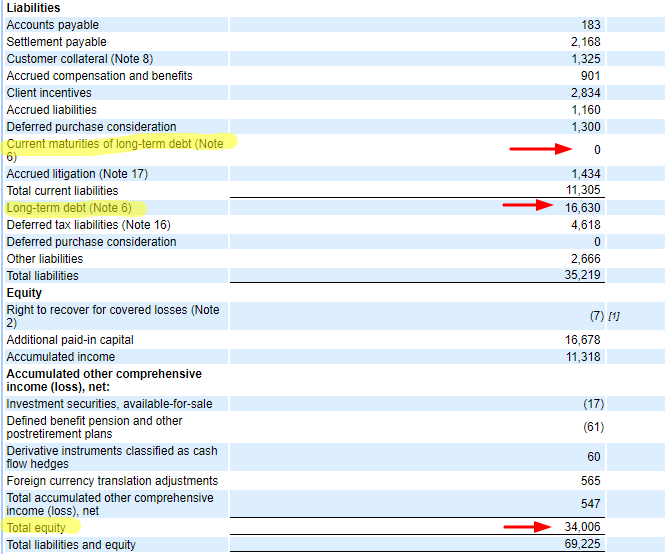
- Current maturities of long-term debt (short-term debt) – 0
- Long-term debt – $16,630
- Total Shareholder Equity – $34,006
Now we can plug all of our numbers into the formula.
CROIC = (( Operating Income x (( 1 – ( Income Taxes / Income before Taxes )) / ( Short-term debt + Long-term debt + Shareholders’ Equity )
CROIC = (( $12,594 x (( 1 – ( $2,505/ $12,806)) / ( 0 + $16,630 + $34,006 )
CROIC = (( $12,594 x ( 1 – .1956 ) / $50,636
CROIC = $10,130.61 / $50,636
CROIC = 20.00%
Visa does a fantastic job of reinvesting their cash, and they generate $0.20 of free cash flow from every $1 of operating income, which is outstanding. Compare that to the level that Disney is currently performing, and you can see that Visa is more efficient with its use of free cash.
Let’s take a look at one more just for giggles. How about we look at Netflix (NFLX)?
For this example, I will pull the data from their income statement and balance sheet for us to calculate.
The data we need for our formula:
- Operating Income – $2,602
- Income Before Income Taxes – $2,062
- Income Taxes – $195
- Short-term debt – 0
- Long-term debt – $14,759
- Shareholders’ Equity – $7,582
Now that we have our numbers, we can pull together our formula to figure out the cash return on invested capital for Netflix.
CROIC = (( $2,602 x ( 1 – (( $195 / $2,062)) / ( 0 + $14,759 + $7,582)
CROIC = (( $2,602 x ( 1 – .0945 ) / $22,341
CROIC = $2,356.11 / $22,341
CROIC = 10.54%
Netflix also does a good job of creating free cash from their operating income, not as well as Visa, but much better than Disney.
These are useful exercises to determine the profitability and efficiency of different companies, plus it is a great tool to help screen for companies that are great capital allocators.
For example, I will calculate a few more to give us a flavor of how this works over several different industries.
- Apple – 27.06%
- Amazon – 9.64%
- Tesla – 0.35%
- Exxon – 3.82%
- Verizon – 13.63%
- Microsoft – 21.35%
- Mastercard – 55.2%
As we can see from the smattering of results from a few different industries, tech companies rule this ratio. It is not a great indicator for financials as more of their liabilities are tied up in deposits than debt. Banks use deposits to fund their growth as opposed to debt, like many in the tech world.
Final Thoughts
Finding companies that are great capital allocators is the goal of every investor. Using a tool like the cash return on invested capital is a great formula to help us find those companies.
Warren Buffett speaks many times through his Letters to Shareholders about the importance of capital allocation. To him, it is probably the most important role a CEO can play. In his view, returning capital to shareholders is job number one, and finding leaders that excel in this area is very rare. Buffett laments this fact and states that most CEOs struggle with this role because most of them are either operators or salesmen, which is how they rose to the role of CEO. But those strengths often lead to struggling to become world-class allocators of capital, and that is what Buffett seeks when he is determining the viability of buying any particular company. He often says that great management is just as important as a great price.
As a matter of fact, Buffett often refers to buying a company that any idiot can run because eventually, one will!
The formula we discussed today is fairly simple to execute; the most difficult part is navigating the line items from the financial statements to find the data we needed. As with all formulas, this one should be used in conjunction with others to help you form your opinion of the company. Never use this one formula or any others as your sole decision-maker when making a buying or selling decision. Rather use tools like the cash return on invested capital formula as another in your list of checklists.
That is going to wrap up our discussion today on cash return on invested capital.
As always, thank you for taking the time to read this post, and I hope you found something of value on your investing journey.
If I can be of any further assistance, please don’t hesitate to reach out.
Until next time.
Take care and be safe out there,
Dave

Dave Ahern
Dave, a self-taught investor, empowers investors to start investing by demystifying the stock market.
