Updated 5/29/2023
Focusing on the returns on invested capital a company produces helps us better understand how well it sets itself up to grow.
A company with strong returns on invested capital is the unicorn we all look for, especially when they efficiently use the capital to grow over time. A great way to measure efficiency is the extension of the return on invested capital (ROIC) with returns on incremental invested capital.
After all, it is not just one year’s returns; rather, over a long period, it produces great growth. Charlie Munger said:
“Over the long term, it’s hard for a stock to earn a much better return than the business which underlies it earns. If the business earns 6% on capital over 40 years and you hold it for that 40 years, you’re not going to make much different than a 6% return—even if you originally buy it at a huge discount. Conversely, if a business earns 18% on capital over 20 or 30 years, even if you pay an expensive looking price, you’ll end up with a fine result.”
Charlie Munger
In today’s post, we will learn:
- What is a return on incremental invested capital?
- How Do You Calculate Return on Incremental Invested Capital?
- Examples of Return on Incremental Invested Capital
Okay, let’s dive in and learn more about return on incremental invested capital.
What is a Return on Incremental Invested Capital?
To understand returns on incremental invested capital or ROIIC, we must first understand the return on invested capital; without foundation, much of today’s work will not make much sense. My suggestion is if you are fuzzy at all about ROIC, please refer to these articles and come back:
How to Calculate Invested Capital for ROIC (the right way)
How to Calculate NOPLAT for Operating ROIC
WACC vs. ROIC: Is Shareholder Value Being Created or Destroyed?
Okay, now we understand ROIC and its implications; the basic idea is a company will create more value from its invested capital than the cost of capital will experience greater growth over a long time.

Diving deeper into the ROIIC idea, as we look for companies creating value from their invested capital into the future, we need to remember ROIC measures how efficiently a company uses its capital already purchased. Instead, we want to measure how much a company can grow with its future investments.
Nobody I am aware of can see into the future, but using a formula allows us to peek into the future.
We must embrace that each company we encounter is different and will have unique capex requirements, cash flow generating ability, R&D requirements, reinvestment opportunities, etc.
Each business will have different requirements to operate its business, and we must account for those differences individually, but the central idea remains the same:
Identify a business with multiple opportunities to reinvest its capital at high rates of returns into the future.
To help solidify the concept, let’s talk about Warren Buffett’s one-dollar test. The main idea is whether one dollar invested in the company creates more than one dollar in the market.
Let’s look at a simple example. Say a company invests $1,000 in a new restaurant and estimates that its cost of capital is 10 percent. If the factory had to create $80 in after-tax earnings forever, the restaurant’s market value would be $800 ($80/10%), and the investment would fail Buffett’s one-dollar test. If the restaurant’s earnings were $120, which would create a value of $1,200 ($120/10%), thus passing the one-dollar test.
The simple example above helps explain why the market reacts as it does when the announcement of an acquisition or any additional capital expenditures and how they might impact the business’s value.
How Do You Calculate Return on Incremental Invested Capital?
There are multiple ways to measure and calculate ROIC, but most boil down to the simple idea, some earnings, net income, net operating profit (EBIT), or net operating profit after taxes (NOPAT). It is then dividing that by the total debt and equity.

Joel Greenblatt likes to determine what kind of tangible capital the company uses, so he defines ROIC as earnings or pretax earnings divided by working capital plus net fixed assets, the same as adding the debt and equity and subtracting out the goodwill and intangibles. Finally, we want to exclude excess cash from the calculations, as we want to know how much capital it takes to run Microsoft, for example.
No matter how precisely we try to measure the ROIC, the most important idea is to measure how efficiently the company uses its capital to create more growth.
A rough back-of-the-envelope way of thinking about the return on incremental invested capital is to look at the total amount of capital the company has added over time and compare that to the incremental growth in earnings over the same period.
For example, last year, Amazon earned $21.3 billion of net income compared to $157.7 billion of debt and equity, for about 13.5% returns on capital.
Not horrible, but what do we want to know if we were going to invest in Amazon?
Let’s think about investing in Amazon ten years ago. At that time, we would have three main conclusions, excluding valuation for the moment:
- How much cash would Amazon produce in the future?
- How much cash would they return via dividends or share repurchases?
- What rate of return of the money not returned to shareholders via dividends or repurchases would Amazon get on the money it keeps and reinvests?
Our answers will help us determine Amazon’s future earnings power. Let’s look at how Amazon did over the past ten years.
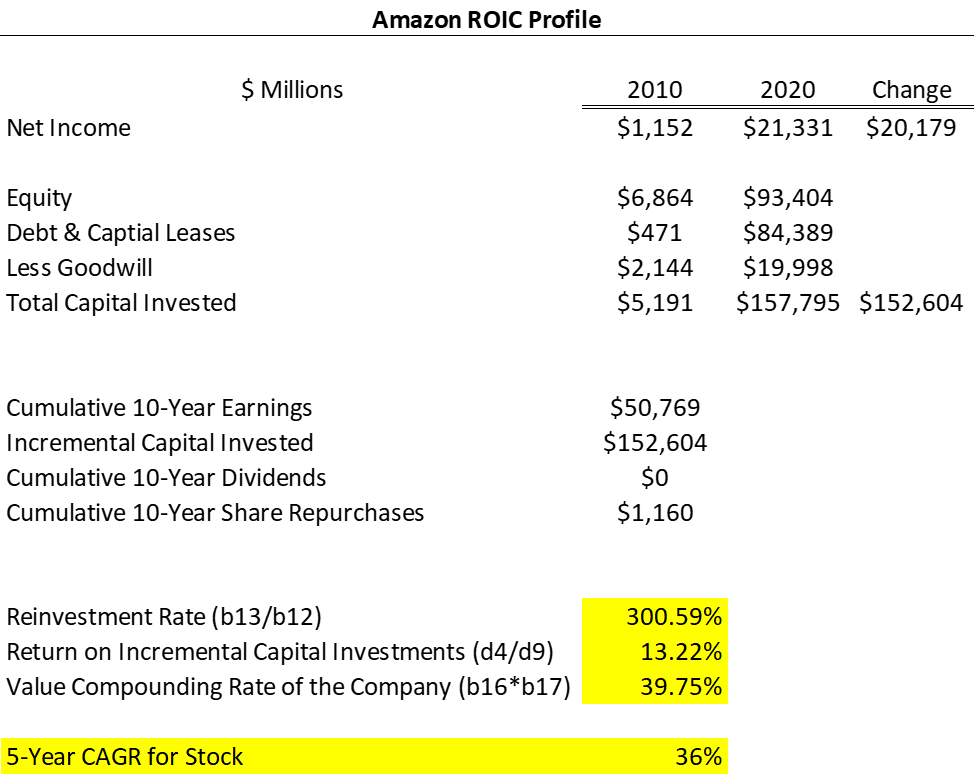
In 2010, Amazon earned $1.15 billion on approximately $5.19 billion of invested capital, for 22.15%.
Over the next ten years, Amazon invested $152.6 billion in debt and equity, meaning Amazon’s total capital grew from $5.19 billion in 2010 to $157.7 billion in 2020.
Using the incremental capital of $152.6, Amazon grew its earnings by $20.1 billion, from $1.15 billion in 2010 to $21.3 billion in 2020. So in the past ten years, Amazon grew its return on incremental invested capital at 13.22%, down from the starting point of 2010.
Diving a little deeper, we can see that Amazon grew its cumulative earnings over those ten years by $50.7 billion when compared to the incremental invested capital of $152.6, which gives us a reinvestment rate of 300%, which tells us that the company retains $3 for each $1 the company earns.
We determine that by dividing the incremental capital that Amazon has invested over the past ten years ($152.6 billion) by the company’s total earnings over the same time ($50.7), which gives us a reinvestment rate.
To determine the total return we could expect for Amazon over those ten years we:
Intrinsic value compounding rate = ROIC x reinvestment rate
Where each for Amazon:
- ROIC = 13.22%
- Reinvestment Rate = 300.59%
This gives us an annual compounding rate of 39.75%, compared to the actual compounded annual growth rate of the price of Amazon from 2010 to 2020 of 36%.
The chart below lays out the process for determining the ROIIC for Amazon and the impact on the company’s growth by determining a reinvestment rate. Notice that the company returns almost nothing to shareholders in the form of dividends or repurchases, which is the method most common in today’s markets. It all makes sense when you consider Jeff Bezos’s focus on cash flows and using that cash to grow the company. And who could argue with that success?
Keep in mind this is all estimates and not actual valuation. We are looking at how efficiently Amazon reinvests its capital to grow the company. Because Amazon doesn’t return any capital via dividends or buybacks, share appreciation is the means of capital appreciation for investors. Some companies with lower returns on capital or reinvestment rates might pay out larger portions of their capital as dividends or buybacks, which equals a higher expected return.
As mentioned earlier, analyzing each business presents different situations, so we must understand the formulas’ concepts. Hence, we know how to interpret the results or give us a better chance of understanding why they function as they do.
Examples of Return on Incremental Invested Capital
Let’s use the above framework to analyze a few companies. And the first one I would like to analyze is Etsy (ETSY), a company that has been able to reinvest its capital at very high rates over the past five years.
Etsy ROIC
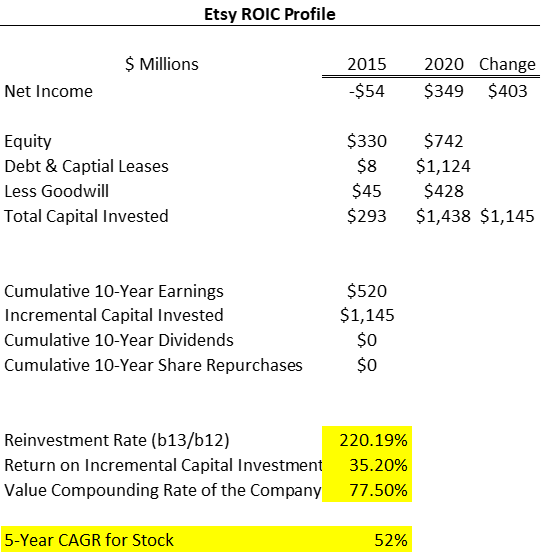
For Etsy, we will look at the last five years of operating results, starting with 2015, shortly after the company went public via an IPO.
Etsy has some great economics, with growing buyers and sellers on its platform. The company has grown revenue by 95% over the past year, with upwards of $450 million of free cash flow from $1.4 billion in revenues. The company currently has a market cap of $24.6 billion. Over the years, the operating margins grew as the company continued to build its platform. The company has a two-sided marketplace that generates revenues from the buyer and seller sides.
Etsy has grown its net income from a $54 million loss to $349 million, a growth of $403 million over the five years. Invested capital grew from $293 million in 2015 to $1.43 billion in 2020, for incremental invested capital of $1.14 billion.
All of that equals a ROIIC of 35.20% over the five years and a reinvestment rate based on the cumulative earnings over the five years of $2,196 million, for 220.19%. Considering the expected annual growth from the incremental invested capital, we get 77.50% versus the actual compounded rate of 52%.
Target ROIC
Next, let’s take a look at Target. We have focused on some growth-type companies that operate in the retail space, mainly with Amazon’s AWS contributing mightily to its impressive performance.
Target is a different beast, with the company operating longer than Etsy and transforming to a bigger online presence to compete with Amazon, Walmart, and Etsy.
Target also uses its capital differently than the other previous examples. Target is a dividend payer who repurchases large shares to return capital to investors. Some might say Target is in a different development stage than the previous two companies; not saying it is old, but different. And who among us can go into Target and not walk out without spending $50!
As we can see from the below chart, Target saw a decrease in its invested capital over the ten years, with its ratio of 9.4% in 2010 growing to 15.3% in 2020. But the company produced that revenue growth without increasing its total capital. Instead, its incremental invested capital has shrunk over the ten years, which indicates that the company might not be making capital investments to grow.
Target is a retailer that depends largely on its physical locations to produce the majority of its revenue, although the online portion is growing. But the company has slowed its expansion of stores over the last few years, which we see reflected in the incremental capital because those store expansions would come in the form of increased debt to build.
Another point to notice, the cumulative ten-year net incomes are $28,780 million compared to the total of dividends paid and share repurchase over the same time of $32,820 million ($12,495 million in dividends and $20,325 million in buybacks). To me, that indicates the company is paying out its capital to shareholders in those forms instead of reinvesting in the company to drive growth. It also might bear some investigation into how they fund those dividends and buybacks.

Intel ROIC
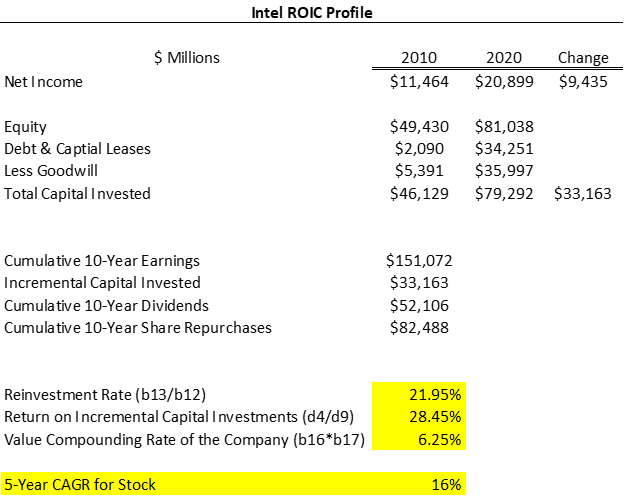
The last company I would like to use as an example of incremental invested capital is Intel (INTC) and its impact on the company.
Intel is one of the leaders in the semiconductor space and has been in operation since the early 1960s. The company has stumbled recently in the race to design and create the smallest semiconductor chip, but its revenues and margins are to die for, with revenue growth of 8% in a tough 2020.
Intel is capital-intensive compared to Etsy and Amazon, which have much lower capital requirements. Intel spends more on R&D than all three companies highlighted earlier, with its gross, operating, and net margins higher than those.
Intel grew its ROIC in 2010 from 24.85% to 26.35% in 2020, with the incremental invested capital growing to 28.45% over the ten years. Not too shabby, and based on the reinvestment rate and the return on incremental invested capital, Intel’s expected annual growth was 6.25% compared to 16% over the ten years.
If we look at the cumulative dividends and buybacks, we can see the company has returned 89% of its net earnings to shareholders in those methods. Compared to the higher ROIIC of both Amazon and Etsy, we can see that both companies are driving great returns based on their reinvestment rates and use of incremental invested capital.
Investor Takeaway
We all seek to find great companies that compound those returns over time. Peter Lynch’s famous 10-baggers came from companies that could retain their earnings and put them back into the business at high rates of returns over many years.
To sum up what we are looking for:
- How much can the company reinvest into its business?
- What will that return be on the investment?
If Target earns $16 million and reinvests $4 million of that back into the business, how much additional cash flow will come from that investment? Compare that to the same scenario for Etsy and its 35.2% ROIIC, and we know that Etsy will create more value on its reinvestment.
The above ideas are a rough way to think about returns on incremental invested capital, and you can drill down deeper on each variable. For example, you could easily substitute operating earnings or NOPAT for net income. And you could use different methods to determine invested capital, such as changes in working capital, net capex, etc.
You can also pick apart the capital expenditures by determining what portion is maintenance capex versus growth capex, which are all important. There is also the matter of other investments that run through the income statement, such as research and development expenses or advertising costs. These items are not “capital” investments but impact the growth of many different types of businesses, such as Intel.
My intention with this post was to highlight the idea of return on incremental capital and its impact on the growth of the company and the expected growth over time. The formula set up earlier is in the spreadsheet I included for download, so you can put this into practice with any company you wish, which I strongly encourage you to do. It is adaptable, so you can alter the basic ROIC formula to fit your needs.
And with that, we will wrap up our discussion on return on incremental invested capital.
Thank you for reading this post; I appreciate it and hope you find something of value on your investing journey. If I can further assist, please don’t hesitate to reach out.
Until next time, take care and be safe out there,
Dave

Dave Ahern
Dave, a self-taught investor, empowers investors to start investing by demystifying the stock market.
