The degree of financial leverage (DFL) is not to be confused with the more popular balance sheet metric, financial leverage. While they have strong similarities both calculating risk (and reward!) from the use of debt, they go about measuring that risk in two different ways.
Unlike the balance sheet metric financial leverage, the “degree” of financial leverage is concerned solely with the income statement. As usual, higher leverage means more risk and volatility in earnings.
The DFL can be very meaningful to investors and internal management by helping them understand how exposed the business’s net income is to changes in operating income, and it says a lot about the capital structure of the business.
This article will discuss the logic of DFL, its difference from balance sheet focused financial leverage, while using a real-life example with Walmart to gain some perspective.
The Formula and Logic behind Degree of Financial Leverage
As can be seen in the formulas below, the degree of financial leverage can be calculated from the income statement alone. The DFL formula measures the change in net income for a 1% change in operating income (which can also be referred to as earnings before interest and tax or EBIT). The output of the DFL formula can be read as “for each 1% change in operating income, net income will change by X %”.
While the formulas only talk about interest expense as it is the most common type of financing, if the company has any preferred equity in their capital structure, the dividends on preferred equity should be included as well. If a business is profitable and has zero financing other than equity capital, the DFL will be equal to 1. In most cases though, the DFL will always be greater than 1 as debt and preferred equity financing are often used to leverage equity capital.
Now let’s get into the formulas starting with the most basic one below.

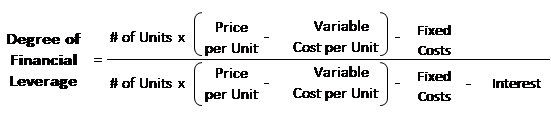
The DFL formula can also be expressed on a per unit or volume level similar to the degree of operating leverage formula, but DFL now includes fixed costs in the numerator as well as interest expense in the denominator.
The third formula to calculated DFL compares the company at two points in time and the change in net income that took place based on the changes in operating income.

Degree of Financial Leverage vs. Balance Sheet Financial Leverage
While both the degree of financial leverage as calculated from the income statement and the more common balance sheet financial leverage metric have to do with quantifying the risk of a company’s capital structure, they go about it in two different ways and can sometimes give conflicting results.
The differences arise because interest rates charged on debt can vary greatly between companies or industries, and interest rates charged on the debt can also change over time. The amount of financial leverage on the balance sheet can be the same, but if interest rates differ, the degree of financial leverage will be different due to the interest expense being charged on the same dollar amount of debt.
Example Calculating Walmart’s Degree of Financial Leverage
To get comfortable with the formula and add some real-life perspective, let’s now look at the degree of financial leverage with retail giant Walmart. For our example, we will use the first formula discussed to calculate the DFL for Walmart’s 2019 fiscal year. Take note that we are not only including interest expense but are also including capital lease obligations as well.
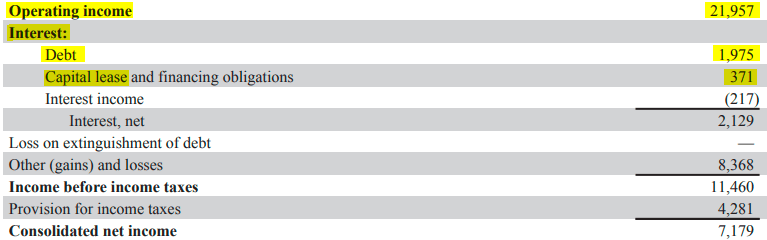
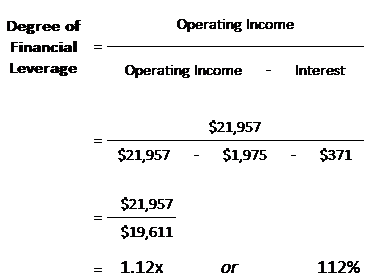
As can be seen in the formula below, the DFL at Walmart based on 2019 figures can be calculated as 1.12x or 112%. This means that for each 1% percentage change in operating income, net income will increase by 1.12% (which is 1.12x or 112% of 1%).
Takeaway
Understanding a company’s degree of financial leverage can allow an investor to assess the risk and return inherent in the capital structure. Interest expense is the most common type of financing, but if the company has any capital lease obligations or preferred equity in their capital structure, the associated payments should be included in the DFL calculation as well.
