The term degree of operating leverage (DOL) does not get as much attention as its more forthright cousin, financial leverage, but is just as important in determining the risk (and reward!) of a company. The degree of operating leverage is easy to calculate using only certain key line items on the income statement.
The figure can be very meaningful in helping investors and internal management to understand how exposed the business is to changes in sales, before considering the degree of financial leverage.
This article will discuss the formula and logic behind DOL and finish with a real-life example with Walmart to add some practicality.
The Logic and Formula for Degree of Operating Leverage
The degree of operating leverage aims the capture the effect of changes in revenue on operating income. The formula measures the change in operating income, also referred to as earnings before interest and tax (EBIT), for a 1% change in revenue. The output of the DOL formula can be read as “for each 1% change in sales, operating income will change by X %”.
Ideally the figure is based off sales, variable costs, and fixed costs. While these items can be approximated by line items on the financial statements, only internal managements know the exact cost patterns based on units or sales volume. That being said, analysts and investors can back into the per unit numbers by dissecting the income statement and volume figures provided in financial reports. Below are three formulas to calculate the DOL based on available information.
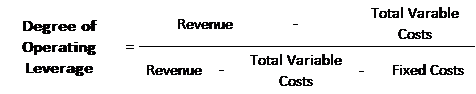
The first formula that can be used to calculate the DOL is an ideal formula which breaks costs down between variable and fixed.
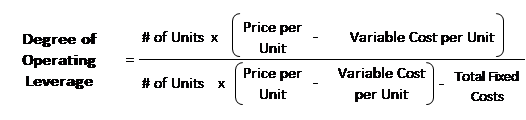
The second formula that can be used to calculate the DOL is also ideal. It is still breaking down costs between variable and fixed but it now is also looking at revenues and costs on a per unit or volume basis.
The third formula that can be used to calculate the DOL is not ideal but can be a good approximation for external analysts and investors. It uses common line items on the income statement and analyzes the rate at which operating incomes (EBIT) is changing as sales change.
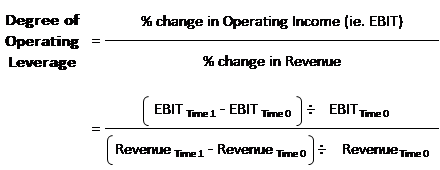
Side Note: By analyzing the change in operating income as sales change, this third formula is indirectly capturing the breakdown of variable and fixed costs. In reality, not all costs of goods sold are variable and operating expenses fixed (ex. selling costs are operating expenses) and this formula takes that into account.
The Degree of Operating Leverage Changes with Sales
For the same business, the degree of operating leverage changes with sales, as each incremental sale is more (or less) significant in terms of the fixed operating costs that are being leveraged. This point is important for investors to understand because it will affect the rate at which operating profits change throughout the business cycle of the company and as a company grows.
At a higher level of sales, the DOL will be LOWER because variable gross margins are already higher, which makes the amount of fixed operating costs being leveraged less significant.
On the opposite side, when a business has a lower level of sales in its current business environment the DOL will be HIGHER because each incremental sale is more significant in terms of the fixed operating costs that are being leveraged.
Example with Walmart’s Degree of Operating Leverage
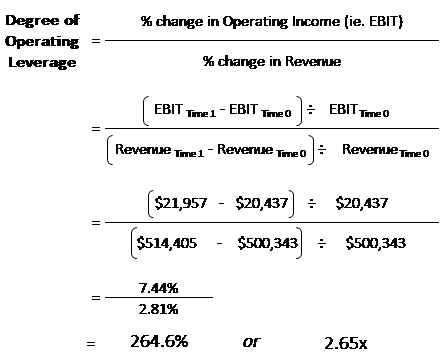
To get comfortable with the formula and add some real-life perspective, let’s now look at the DOL with retail giant Walmart. We will plug in Walmart’s financials over 2018 to 2019 into the third formula discussed earlier.

As can be seen in the formula below, the DOL at Walmart based on 2018 revenue figures can be calculated as 264.6% or 2.65x. This means that for each 1% percentage change in revenue, operating income (EBIT) will increase by 2.65x. This DOL is calculated by dividing the 7.44% change in operating income by the 2.81% change in revenues for the period.
Takeaway
Knowing a company’s degree of operating leverage can be help analysts and investors determine how exposed a company is to changes in the business cycle and also how operating income will benefit from growth at the company. The output of the degree of operating leverage formula can be read as “for each 1% change in sales, operating income will change by X %”.
