To make money, you need to spend money. Companies have to operate on the same principle and successful businesses find a way to generate revenues with fewer costs, creating profits. One way we, as investors, measure profitability is the gross margin.
Gross margins can help us determine how well a company manages its costs. We can also see how much leverage they can drive from those costs.
Some of the most profitable businesses in the world generate great gross margins. The hall of fame of businesses contains companies such as Visa, Mastercard, Costco, Microsoft, Apple, and many more.
More profitable companies can continue to invest, like the names mentioned above. Using the gross profits, Google can invest in R&D, marketing, and sales, which helps the company expand its moat in Search or YouTube.
In today’s post, we will learn:
- What is Gross Margin?
- How Do We Calculate Gross Margin?
- What is the Difference Between Gross and Net Margin?
- What Does the Gross Margin Tell Us?
- What is a Good Gross Margin?
- How to Use Gross Margin to Evaluate a Company
Okay, let’s dive in and learn more about the gross margin.
What is Gross Margin?
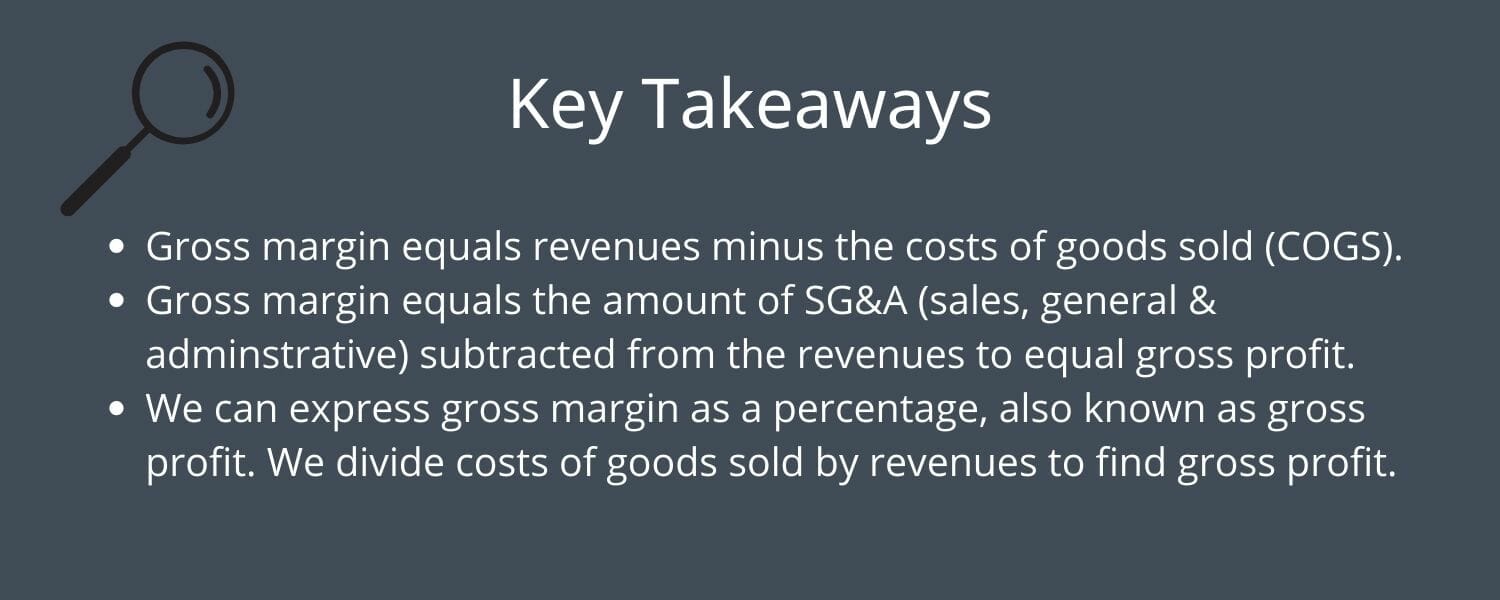
Gross margin equals revenues minus the costs of goods sold (COGS). In reality, gross margin equals the company’s total profit after removing the direct costs.
The higher the gross margin, the better. The higher a company’s gross margin, the more capital or profit Visa retains. The company can then use those profits to pay other costs or pay off debt.
We can also consider revenue from the lens of net sales, which equals gross revenue minus returns, allowances, or discounts. Visa reports net sales less its discounts for vendors to entice them to use Visa-logoed cards.
Explaining gross margin differently, gross margin equals the percentage of a company’s revenue after subtracting expenses such as labor and materials. As the company keeps more and more of its profits, it can use those gains to pay down debt, reinvest, or pay a dividend.
Some companies guide on gross margins, while others use gross margins as a carrot to earn stock-based compensation.
New companies also spend a lot of time and effort working to grow their gross margins. They have several reasons to want to grow those margins. First, the more profit they create, the more they can reinvest to grow. Second, as the company matures, it should create operating leverage, which helps widen its profitability.
How Do We Calculate Gross Margin?
The formula for gross margin equals:

Gross margin = Net sales – COGS
Where:
- Net sales: equals revenues or the total revenues created during the period. We can also refer to them as net sales minus discounts. You could also think of revenues as the top line because it sits atop the income statement.
- COGS: equal costs of goods sold. These are direct costs associated with creating the products and services the company sells. COGS can include direct labor costs or materials used in producing the company’s products or services.
To help illustrate the idea, imagine a business collecting $100,000 in revenue. Let us also assume the costs of goods sold equals $50,000. After subtracting those costs of goods sold from the revenues, the gross margin equals $50,000.
The gross profit ratio would equal 50%, or ($100,000-$50,000) / $100,000.
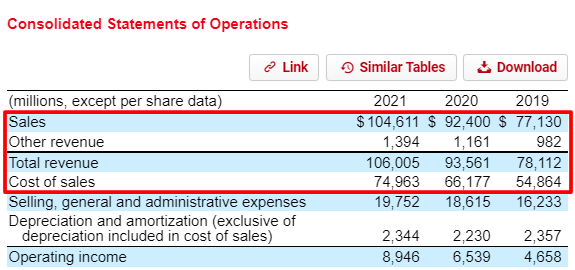
Here is a quick sample of how we can calculate the gross margins from a company’s 10-K, using Target and their latest report, dated January 9, 2022.
|
2021 |
20202 |
2019 | |
|
Total revenue |
$106,005 |
$93,561 |
$78,112 |
|
Cost of sales |
$74,963 |
$66,177 |
$54,864 |
|
Gross margin |
$31,042 |
$27,384 |
$23,248 |
|
Gross Profit % |
29.2% |
29.2% |
29.8% |
As we can see, calculating the gross margin from the financials remains simple, and looking at the margin over a longer period offers a chance to do some analysis.
Most companies will list their gross margin as a separate line item. But you will run into the occasional company that doesn’t, so I wanted to show you Target. We can also use our favorite financial website to find these margins over a longer period.
What is the Difference Between Gross and Net Margin?
The main difference between gross margin and net margin is what they focus on. Gross margin focuses on revenues and the cost of goods sold, whereas net margin focuses on the bottom line and “all” the costs associated with running Target.

When we calculate net margin, we subtract the:
- Cost of goods sold
- Operating costs
- Interest expenses
- Taxes
- Other income/expenses
All to arrive at the bottom line or net income, also known as earnings.
Gross margin focuses on revenues and costs, where net margin focuses on expenses associated with revenue.
Gross margin can help a company, plus investors, assess manufacturing profitability, while net margin helps Target asses its entire profitability.
What Does the Gross Margin Tell Us?
The gross margin (along with gross profit) equals the profit a company retains from each dollar of revenue.

However, we can also refer to the gross margin as the gross profit margin. For example, if Visa’s recent quarterly gross margin equals 85%, that means Visa retains $0.85 for each dollar of revenue.
Because Visa removes the COGS (costs of goods sold), they can use the remaining $0.85 to pay:
- Operating costs
- Debt
- Interest expenses
- Dividends
Companies use gross margins, gross profit, and gross profit margin to measure profitability. For example, Walmart can look at labor and compare the labor to revenue. If the company wants to generate more gross profit, it can use different schedules.
They can also use the gross margin to measure the impact of the costs of materials. For example, if Taiwan Semiconductor (TSMC) sees its profit margins shrink, they can work with suppliers to buy bulk silicon to lower costs and improve profits.
Lastly, Walmart may look at increasing prices to create more profits, as the amount they pay employees wouldn’t increase.
Let’s examine these ideas a bit deeper.
Higher gross margins for a manufacturer such as Tesla indicate they turn raw materials into profits faster. Higher gross margins for Tesla tell us they have greater efficiency than GM, for example.
For retailers such as Target, the difference between markup and wholesale price drive gross margins. For example, the wholesale price equals Target’s price for their TVs. If Target sells a TV at $100 (cheap, I know) and their price is $67, Target gets a 33% margin.
The math works like this:
- Unit margin = selling price per unit – cost per unit
- Margin = Unit margin / Selling price x 100%
Plugging in our simple Target example, we see:
- Unit margin = $100 selling price – $67 cost per unit = $33
- Margin = $33 / $100 x 100 = 33%
Businesses will use the gross margin as a method to track their profitability. For example, retailers focus on markups and margins to generate enough profit and continue product sales. It offers a fine line to walk for businesses. How much is too much?
We investors can use gross margins to compare one company to another. For example, we could compare the gross margins of Apple and Microsoft or Walmart and Costco. These comparisons can help us determine how profitable these companies are.
A word of caution, please don’t compare gross margins across sectors. For example, the gross margin for Costco doesn’t compare to Apple, as it is not an apples-to-apples comparison.
But you could compare the gross margins across the semiconductor sector, including companies such as:
- Intel
- AMD
- Nvidia
- ASML
- TSMC
Comparing the above companies can provide some interesting viewpoints. We can also determine the most profitable company and begin our analysis.
What is a Good Gross Margin?
As with most answers in finance and investing, it depends. Gross margins will vary by industry. However, most in the service-based industry, such as Microsoft, Google, Netflix, and Meta, tend to carry higher gross margins.

The service-based sector doesn’t have large amounts of costs of goods sold, thus the higher margins, whereas the higher cost of goods sold type industries, such as manufacturing, carry lower gross margins. The auto industry is the perfect example of this as they have high costs of goods sold and lower gross margins.
There are always outliers in the different industries, and you need to treat those differently. For example, Costco products have a 14% markup on products they sell. Costco carries a gross margin of 12.1%, compared to Walmart’s current level of 24.6% and Targets of 29.2%.
A great practice I recommend: compare the company you are analyzing to others in their industry over a longer period of ten years. We can see how a company performs and controls costs using a practice like this.
In that vein, Andrew created this great post examining the average gross margins by industry for the S&P 500. He looks at the data from 2001 to 2021, giving us a great reference point for any industry we want to analyze.
For example, if I wanted to analyze PayPal, I would see that the Information Technology sector generated average gross margins of 56%. Then, I would compare PayPal’s to see how they match up at 42.9%. It would give me a starting point to examine why PayPal is lower than the average, which could be good or bad.
How to Use Gross Margin to Evaluate a Company
Margins, such as gross, operating, and net, allow us to measure efficiency. We can see how well each company converts sales to profits using these margins.

Each margin focuses on different stages and aspects of the business. Gross margin helps us see how efficiently Tesla controls its production costs. That control translates into bigger profits farther down the income statement.
Here are the steps to use gross margin in evaluation:
- Assess long-term company comparisons
- Look at the overall industry, along with individual comparisons
- Look for a moat
- Assess the strength of the moat
As we mentioned earlier, the first step to assessing a company is to look at its gross margins. Analyzing those margins over a longer period allows us to see how a company operates through different cycles. Looking at others in the same industry allows us to see who has the most efficient operations.
Gross margins are sticky and difficult to improve. Many new companies assume gross margins will improve as they scale. Often, this is true, but for others, not so much.
For example, the SaaS business model can see big increases in gross margins as they ramp up revenues, creating leverage from their costs to grow sales quicker. But others don’t see this realization as they scale.
Zeroing in on gross margins instead of net income helps indicate which companies have a moat. For example, a company with short-term bloat (high labor costs) can reduce its net income. But as the company scales and reduces the hiring pace, it can grow net income.
High gross margins can state other advantages:
- Operating leverage expansion
- Provide a buffer against rising raw material prices
- Provide the flexibility to generate growth from R&D or advertising
Gross margins can also point to a moat or competitive advantage. Christopher Mayer offered in his book 100 Baggers that Gross Margins are more likely to point to a moat. He believes gross margins convey more indications of a moat than operating margins. Mayer thinks a company can improve operating margins by cutting operational fluff.
Moats can attract competition; Jeff Bezos once said, “your margin is my opportunity.”
Companies with higher gross margins attract attention because others believe they can take some of the pie. A good indicator of a company with a moat is others trying to chip away at the moat.
For example, the streaming industry has become far more competitive. Companies such as Disney, Amazon, and Paramount have all entered the streaming wars. For a long time, most assumed Netflix operated with an unassailable moat.
As companies grow their revenues and improve margins, more incremental profit drops to the bottom line. But suppose two rivals each grow revenue by a dollar if it costs one of them ten cents to generate the revenue and the other 80 cents. The growth is more valuable for Company A than B.
Businesses with higher operating margins are stronger than those with lower ones.
Investor Takeaway
Gross margins help investors assess a company’s profitability. It all starts with revenue and revenue growth. A company’s value ties closely to revenue growth, which makes sense. As a company grows its revenues, it has more profit to invest.
With good cost controls, revenue growth flows directly to free cash flow.
But like any margin or ratio we discuss in finance, it has its limitations. For example, gross margins don’t give us much insight into companies across different industries. Apple generates high profits from its products and services; compared to others in the same industry, they might not stack up as favorably, whereas Bank of America does produce great profitability compared to others in the same industry.
But we can’t compare the gross margins of Apple to Bank of America; it wouldn’t offer a fair comparison.
Gross margins can offer insights into whether a company operates with a moat. And that information can help us dig deeper into our analysis.
Understanding gross margin components, how to calculate, and how to asses will help you become a better investor.
And with that, we will wrap up our discussion concerning gross margins.
Thank you for reading today’s post; I hope you find something of value. If I can be of any further assistance, please don’t hesitate to reach out.
Until next time, take care and be safe out there,
Dave
