Post updated: 9/07/2023
Price/Earnings ratios, or P/E’s, are a good ratio to give you a quick snapshot of the company’s cost. But with that being said, doesn’t it make you question the historical P/E ratios for that company as well?
For instance, it’s good to understand that the P/E ratio of a company is 15, but I’d like to know what the previous P/E ratios for that same company might’ve been.
That might give me a look to how the company is trending and potentially give me some insight about whether a company is truly “cheap” compared to their history and their peers.
Table of Contents
- How to Find Historical P/E with an Example
- Analyzing a Company’s Historical P/E
- Another Tool to Analyze P/E Ratios

How to Find Historical P/E with an Example
The main tool I prefer when looking at historical P/E ratios is Macrotrends. Macrotrends gives you a lot of great historical information and is completely free, which doesn’t always seem to be the case.
When you go to Macrotrends, the landing page looks like this:
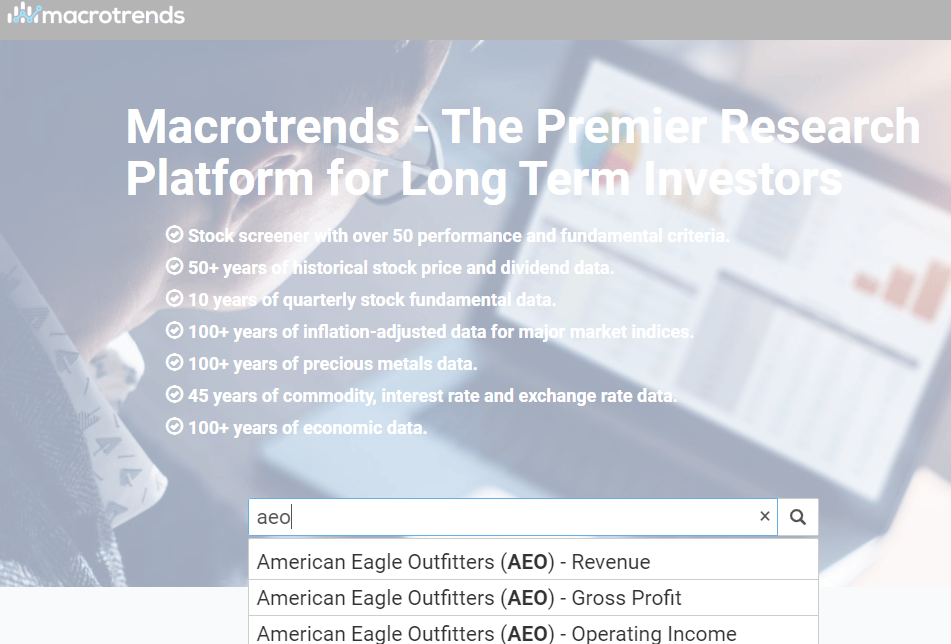
For the purposes of this example, let’s take a look at American Eagle Outfitters, or AEO. To search for them, I will type AEO into the search bar and just click on one of the automatic options that populate.
I’ve learned from this tool that the auto-populate options aren’t too helpful, so just pick a random one and then navigate from there. I am going to click on the Revenue option from the screenshot below:
Now that I am on the page below, I am going to click on the Price Ratios option as you can see my mouse being hovered over:
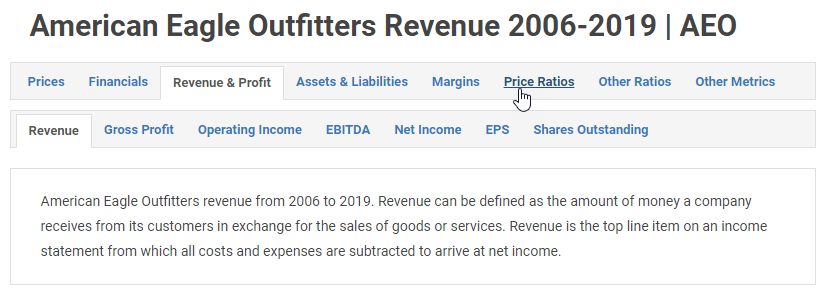
Once you click on the Price Ratios option, you can scroll through multiple charts and tables showing the historical pricing information for this stock, but only from the dates listed above.
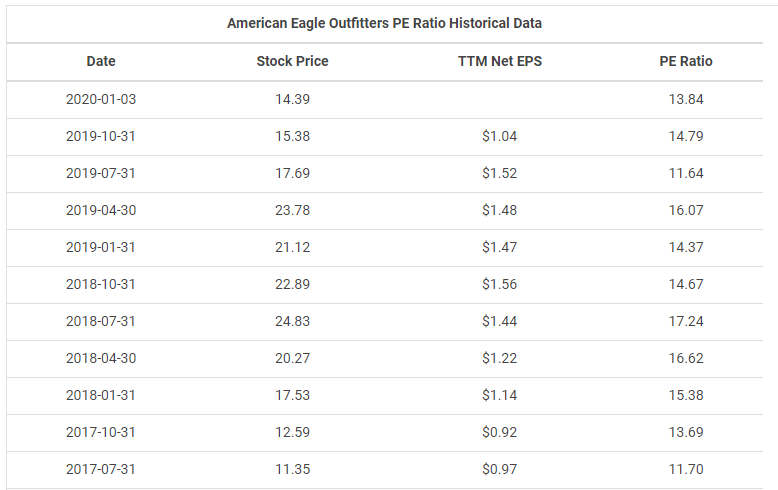
The first set of charts shows you the Stock Price, the TTM (Trailing Twelve-month) Net EPS and the P/E Ratio. The screenshot below shows the different graphs from Macrotrends:
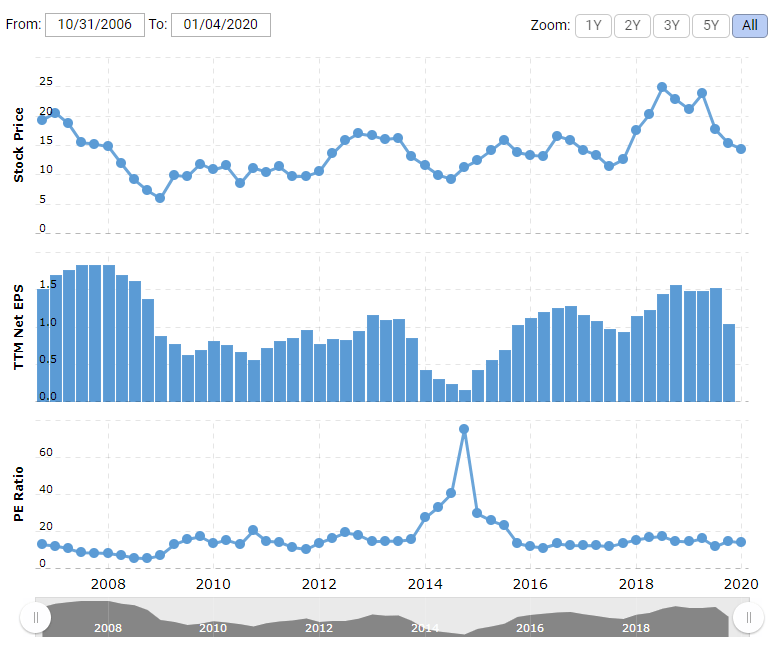
I love that Macrotrends shows us the Stock price and the TTM Net EPS because the P/E ratio is a very simple ratio comprised of price and earnings, but if there’s a major change in the P/E, it’s good to know what caused it without having to do any more research.
I have always been taught in my day job to try to anticipate the next question and have the answer ready, and this is what Macrotrends is essentially doing.
Analyzing a Company’s Historical P/E
For instance, in the P/E ratio chart at the bottom, you see a HUGE spike in the P/E ratio for the quarter ending 10/31/14 where the P/E actually spiked up over 75 vs. the average before that being right around 15 – 20.
So, what caused that?
Well, we know that it obviously has to be either the Price or the Earnings. Looking at the stock price chart during that time period, nothing appears to be wonky so it must be the EPS. When we look at the EPS chart, we can see that the same time period has a very, very low amount of earnings compared to other quarters.
When you hover over the bar graph, it shows that the TTM Net EPS was $.15 compared to most TTM periods being $.50 – $1.50 – aka a major concern. But the point is that I was able to identify this pretty quickly, so now I can go do my own research as to why the EPS was so low during 2014.
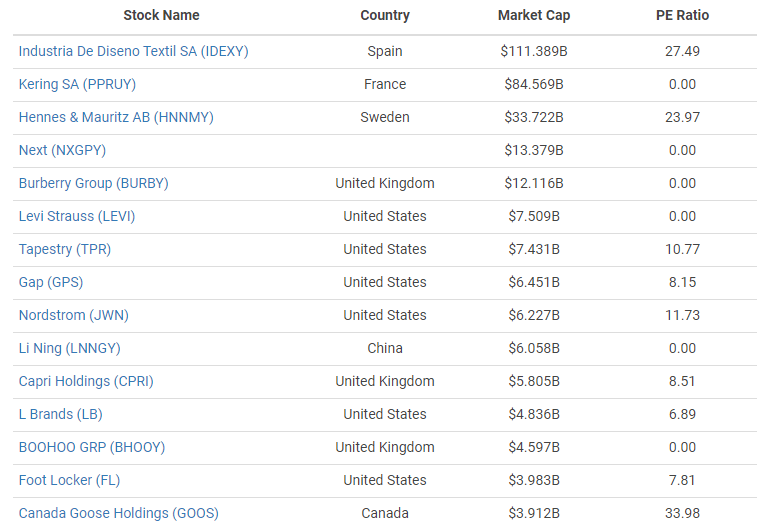
If you keep scrolling down on Macrotrends, it will show you the historical P/E ratios in chart form as well as some competitor P/E ratios, both of which are shown below:
Overall, Macrotrends is a great place for historical information and I highly recommend that you take some time to play with the website and see what great information you can find.
Another Tool to Analyze P/E Ratios
Another great tool that Andrew has gotten me to use has been Gurufocus. I like Gurufocus a lot because they do a great job of laying out the essential information in an easy to read way and just get you the data and not all the “fluff behind it”.
When you go to Gurufocus, you can search for AEO and you end up on this landing page:
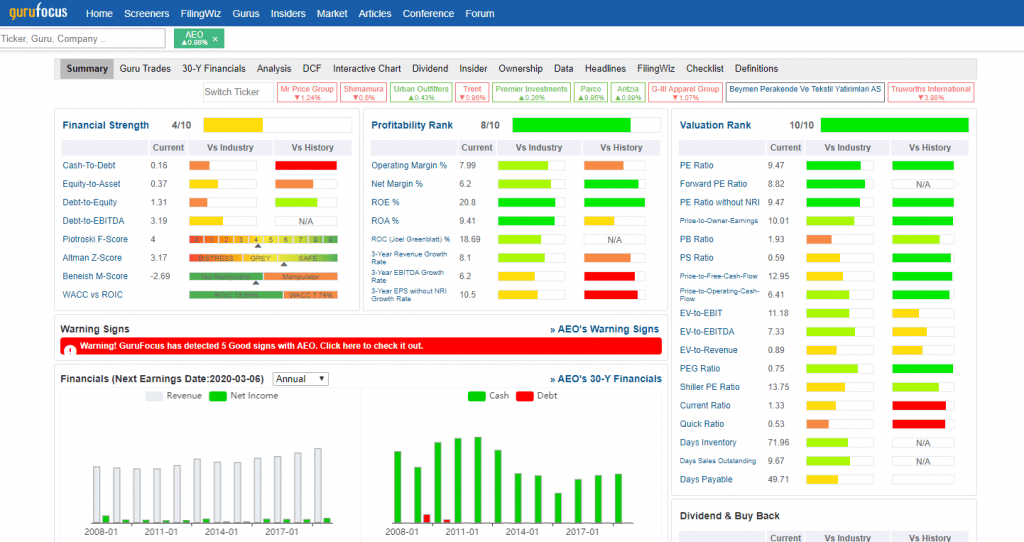
As you can see, there is an absolute ton of data on this, which is right up my alley! We’re going to focus on the Valuation Rank section on the right, primarily on the PE ratio section. If you hover over the “Vs Industry” and “Vs History” sections, then the following windows will pop up for you to read further:
Vs. Industry
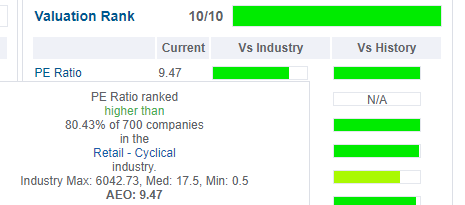
This is helpful because you can see the P/E ratio for AEO vs. its direct competitors in the specific industry that they’re in. In this case, AEO has a P/E of 9.47, which is significantly below the median (or middle) of the companies.
If you’re not familiar with the term ‘median’, it’s essentially a way to find the average for something with removing outliers, such as the ‘Industry Max’ P/E of 6042.73 that the screenshot is showing.
Vs. History
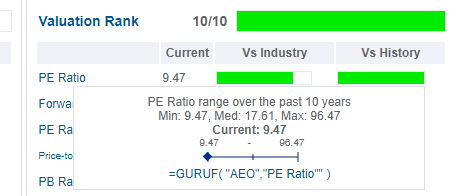
I love this chart because it only shows how the P/E ratio has changed over the years for AEO. For instance, the median is 17.61 over the last ten years and you can see the min is 9.47 which is where it is currently.
So, you can either view that as that the company is very undervalued or that the nature of the business is changing drastically.
As I mentioned, P/E ratios are a great starting point for any analysis, but they should only be viewed as starting points. Anytime that you’re looking at a company as a potential investment or considering to sell, I highly recommend you look at both Macrotrends and Gurufocus before making a decision. Both of them do a great job at giving you some of the information needed to make a good decision on whether to buy or sell the company.
It really just comes down to how willing you are to do the research.
If you’re lazy now, you’ll likely have to work longer to get to that financial freedom goal. It just comes down to what you prefer – being lazy now equals you working harder, later, and longer. Working harder now means being lazy later and earlier. I prefer the latter.
