The income statement is a powerful tool in financial analysis. It offers insights into a company’s performance over a certain period.
By examining the financial statements of a company like Microsoft, we can uncover the nuances and strategic insights hidden within them.
This article aims to demystify the process of analyzing an income statement, using Microsoft as a hands-on example.
In this article, we will learn:
- Understanding the Basics of an Income Statement.
- Step-by-Step Guide to Analyzing an Income Statement
- Common Mistakes to Avoid in Income Statement Analysis
Okay, let’s dive in and learn more about analyzing the income statement.
Understanding the Basics of an Income Statement
An income statement, often called a profit and loss statement, is a financial report that summarizes a company’s revenues, expenses, and profitability over a specific period.

It gives investors and analysts insights into the company’s operational efficiency, profitability, and growth prospects.
We can break the income statement into three main parts:
- Revenues
- Expenses
- Net income
Revenues are the top line in an income statement and are arguably the most important line. They are also referred to as the “top line.”
The next section, expenses, includes all the costs associated with running a business:
- Cost of goods sold
- Operating expenses
- Taxes
- Other expenses
- Other income
The final line, or bottom line, equals the net income. Net income, also known as earnings, equals the profit earned after removing all the costs.
Let’s explore the key components of an income statement, using Microsoft as our real-world example.
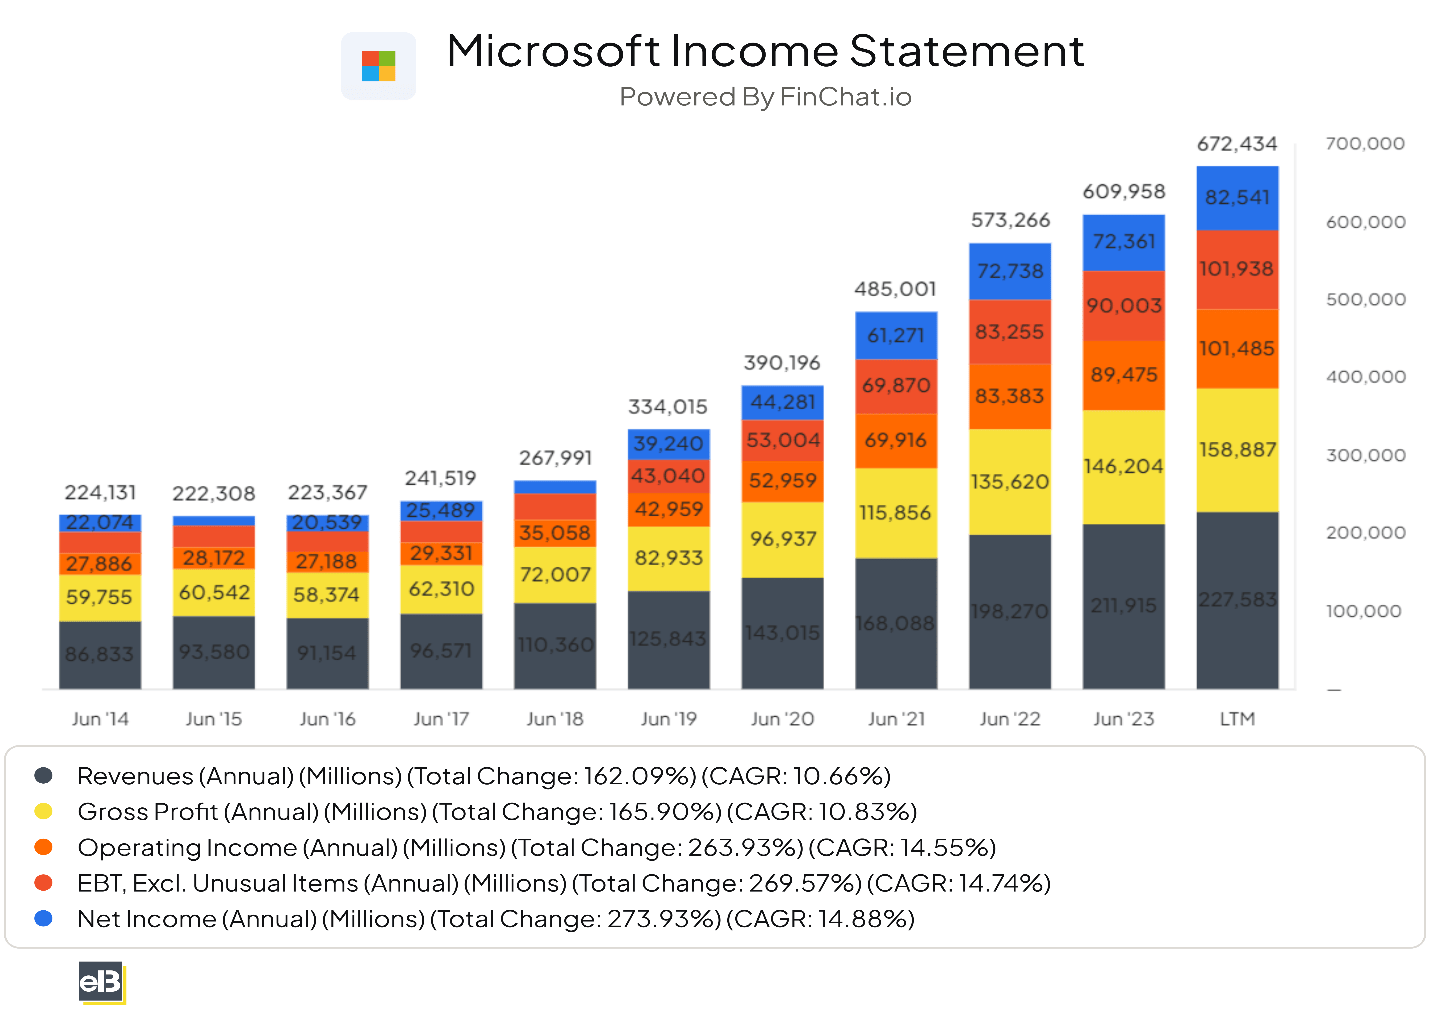
Revenue: This is the income generated from normal business operations. This includes sales from software, hardware, and cloud services for Microsoft. It’s the starting point of the income statement and indicates the total income from business activities.
Cost of Goods Sold (COGS): These are the direct costs attributable to the production of the goods sold by a company. In Microsoft’s case, it could include the cost of software development, manufacturing hardware, or maintaining data centers for cloud services.
Gross Profit: Gross profit is calculated by subtracting COGS from revenue. It reflects the efficiency of a company in managing its production and supply chain. A higher gross profit suggests that Microsoft is efficiently managing its production costs relative to its sales.
Operating Expenses: These expenses relate to the company’s day-to-day operations but are not directly tied to production. For Microsoft, operating expenses might include sales and marketing, research and development (R&D), and administrative costs.
Operating Income: This income results from the company’s primary operations and is calculated by subtracting operating expenses from the gross profit. It’s a key indicator of Microsoft’s core business profitability before financing costs and taxes are considered.
Taxes and Other Expenses/Income: This category includes taxes owed by the company on its income and other non-operating expenses and income. Non-operating items could be interest expenses on debt, interest income from investments, or one-time gains or losses from sales of assets. This could involve expenses or income from foreign operations, investments, or legal settlements for Microsoft.
Net Income: This is the final profit after all expenses have been deducted from total revenue. It’s a critical indicator of Microsoft’s financial health, profitability, and potential to generate cash flows.
Analysts can gauge the company’s performance, operational efficiency, and profitability trends over time by examining these components on Microsoft’s income statement.
Step-by-Step Guide to Analyzing an Income Statement
Analyzing an income statement is critical for understanding a company’s financial health and operational efficiency. We can uncover insights into its profitability, cost management, and overall financial performance by dissecting Microsoft’s income statement.
Here is the process to follow:
- Review revenue trends
- Assess gross margins
- Analyze operating efficiency
- Examine net income trends
- Consider non-operating items
- Calculate and interpret financial ratios
- Compare against industry benchmarks
Here’s a more detailed approach:
1. Review Revenue Trends: Start with a historical review of Microsoft’s revenue over multiple periods. Look for patterns of growth, stagnation, or decline.
Revenue drives all, and we must look deeper into what drives revenue.
Analyze the revenue over longer periods, for example:
- Year-over-year
- Quarter-over-quarter
- 3-year CAGR (compounded annual growth rate)
- 5-year CAGR
- 10-year CAGR
We can better gauge the continuation of growth by determining its drivers, such as a new product or service or greater demand for current products or services.
History can tell us a lot, but it’s not a predictor of the future. But if Microsoft has done well in the past, it’s more likely to continue.
Consistent revenue growth indicates expanding market share, successful product launches, or increased service demand for a tech giant like Microsoft.
Formula: There is no direct formula, but year-over-year percentage change can be insightful:
(Current Year Revenue − Previous Year Revenue) / Previous Year Revenue × 100
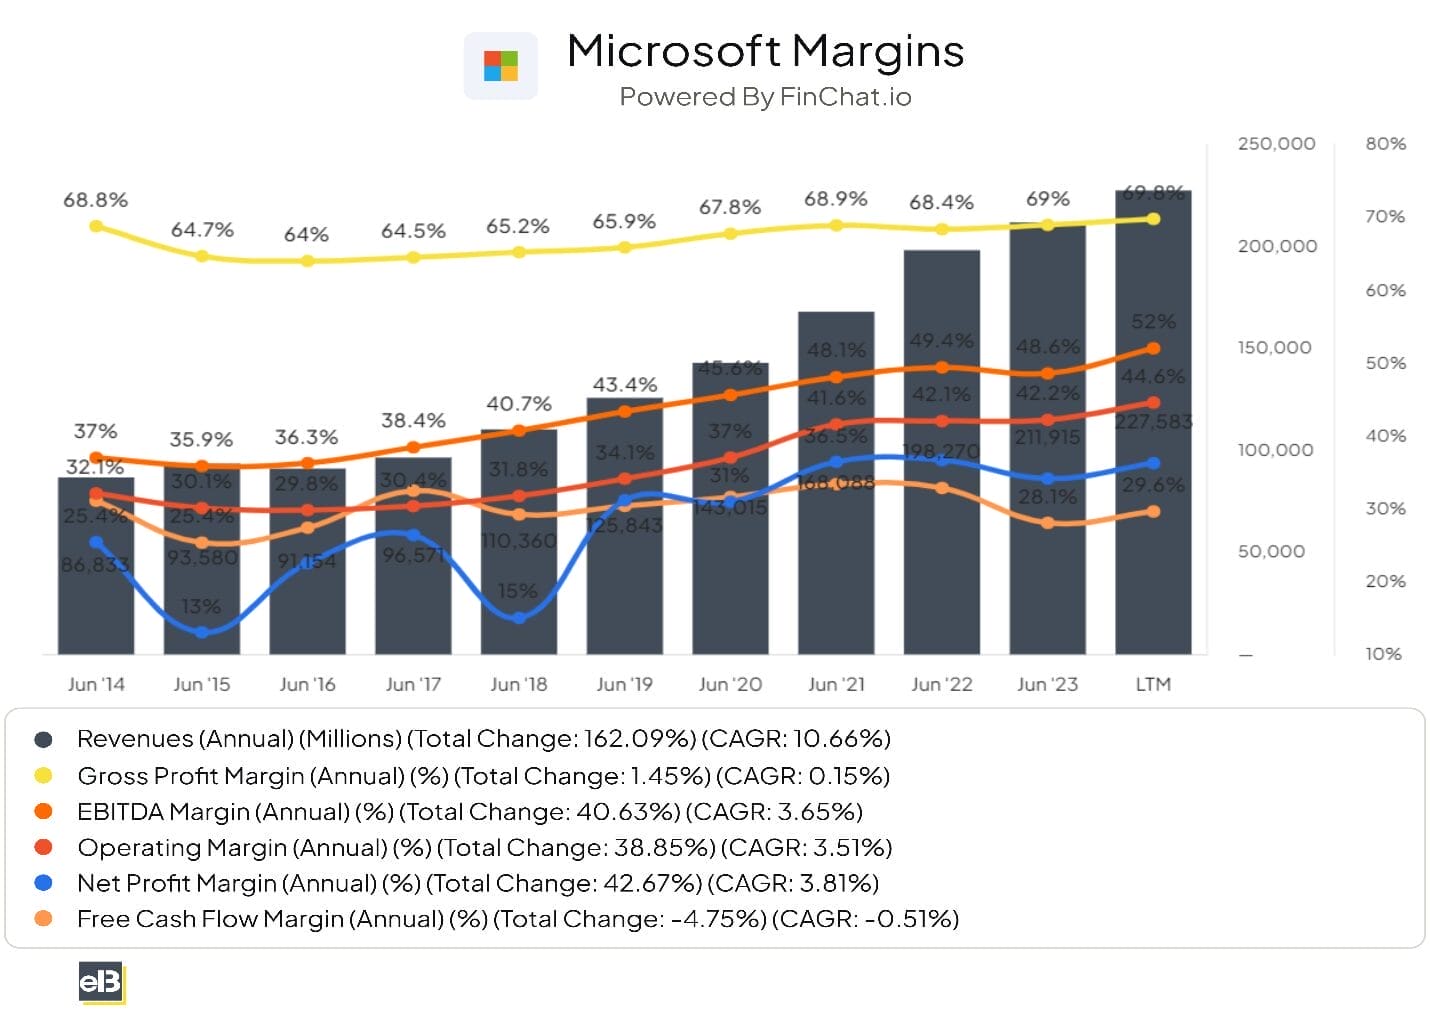
2. Assess Gross Margin: The gross margin reveals the percentage of revenue that exceeds the cost of goods sold, serving as a measure of production and supply chain efficiency.
The gross margin is an underrated tool. For example, it can tell us how efficiently the company uses its costs to generate profits.
The gross margin can also give us insights into pricing power. If you see the gross margins increasing over time, it might indicate Microsoft is exhibiting pricing power. For example, a company like Microsoft creates software like Windows once, and then as they increase the prices, they widen the margin.
Warren Buffett loves companies with gross margins greater than 40%. It is a great target to shoot for, depending on the company.
Formula: Gross Margin = (Gross Profit / Revenue) × 100
Apply this to Microsoft to see how much of its revenue from software, hardware, and services remains after accounting for the direct costs of producing those goods and services.
3. Analyze Operating Efficiency: Operating income, derived from subtracting operating expenses from gross profit, reflects the core profitability from Microsoft’s main business activities before financing and taxes.
Moving down to the income statement, we arrive at the operations level. Here, we see how well the management operates the business.
For example, Microsoft relies heavily on R&D (research and development) to create new products. Although it is a big expense, it helps the company grow. We should look at these as investments in the future.
A great tip is to compare a company’s R&D expenses to its revenues and then compare those ranges over a long period.
Another important distinction is the operating level of the business. It connects directly with a company’s free cash flow and ROIC (Return on Invested Capital) calculations.
These two formulas help investors determine any company’s value and investment efficiency.
It is probably my favorite level of the income statement.
Formula: Operating Margin = (Operating Income / Revenue) × 100
This calculation helps understand how efficiently Microsoft manages its day-to-day operations, including R&D, sales, and general administrative costs.
4. Examine Net Income Trends: Net income, the bottom line, indicates Microsoft’s profitability after all expenses have been deducted from revenue. Trends here reflect the company’s financial health and ability to generate profit.
As with the revenue level, compare the net income to longer periods. Ideally, look at 3-year, 5-year, and 10-year to see trends.
Remember, the net income links to the cash flow statement. It is the beginning of determining cash flow, which is Microsoft’s actual cash in and out.
Formula: Net Profit Margin = (Net Income / Revenue) × 100
This ratio shows Microsoft’s profitability by showing what percentage of revenue remains as profit after all costs.
5. Consider Non-Operating Items: Interest expenses, one-time gains or losses, and foreign exchange impacts can significantly influence net income. For Microsoft, it’s essential to identify and understand these factors, as they can mask the true operational performance.
The non-operating level often gets ignored, but we can find some nuggets here.
If you see wild swings in net income, they likely stem from this level. You will see one-time charges or losses here. For example, if the company has a big legal fee, it will occur on this level. Or if they have to write down an acquisition, it will happen here.
However, you will also find interest expenses and other income from investments on the balance sheet.
Interest expense and taxes are important items to consider.
For example, interest expense compared to operating income can give insight into a company’s solvency. Interest is the debt payment, and if the company struggles to cover that, bankruptcy is in the future.
And, of course, taxes are taxes, but we must understand the impact on profits.
Formula: There is no specific formula, but it’s important to quantify these items and consider their impact on net income.
6. Calculate and Interpret Financial Ratios: Besides margins, ratios like ROA and ROE provide insights into Microsoft’s use of assets to generate income and the return it delivers to shareholders.
Formulas:
- ROA = (Net Income / Total Assets) × 100
- ROE = (Net Income / Shareholder’s Equity) × 100
7. Compare Against Industry Benchmarks: Comparing Microsoft’s financial metrics with its competitors and industry averages reveals its competitive position and potential areas for improvement.
This is an underrated part of the analysis and using this strategy will give you context for how well Microsoft is competing.
Comparative analysis can give you insights into how strong Microsoft is compared to others.
Common Mistakes to Avoid in Income Statement Analysis
Analysts seek to uncover financial performance and health details when dissecting an income statement, such as Microsoft’s.

However, several common pitfalls can distort the analysis if not carefully navigated:
1. Overlooking One-Time Items: Microsoft may report significant one-time events, such as asset sales, restructuring costs, or legal settlements, which can materially impact its net income. Neglecting these can mislead analysts about the company’s regular operational profitability.
Reasoning: Adjusting for one-time items allows for a more accurate comparison of Microsoft’s financial performance over time, providing a clearer view of its operational efficiency and profitability trends. For instance, a large one-time gain from selling a business segment could inflate net income, giving an overly optimistic view of profitability that’s not sustainable from regular operations.
2. Ignoring Contextual Factors: Microsoft’s financial results are not immune to the economic environment, regulatory changes, or shifts in consumer behavior. Analyzing its income statement without considering these external factors can lead to misinterpretations of its financial health.
Reasoning: An economic downturn may decrease demand for Microsoft’s products, adversely affecting its revenue. Without considering this context, a decline in revenue might be incorrectly attributed to internal company issues rather than broader economic conditions.
3. Misinterpreting Margins: Margins measure Microsoft’s operational efficiency and profitability. However, interpreting these figures without context — such as historical performance or industry benchmarks — can lead analysts to draw incorrect conclusions about the company’s health.
Reasoning: If Microsoft’s operating margin decreases from year to year, it might indicate rising costs or falling sales. However, if the entire tech industry is experiencing similar trends due to increased competition or higher material costs, Microsoft’s performance may be relatively strong.
4. Neglecting Revenue Quality: Not all revenue is equally valuable. Microsoft’s recurring revenue streams, such as cloud services or software subscriptions, are generally more stable and predictable than one-off sales, indicating a healthier financial outlook.
Reasoning: High-quality, recurring revenue is indicative of a sustainable business model. Analysts should differentiate between these revenue types, as a company relying on one-off transactions may face more financial instability than one with steady, recurring income.
5. Underestimating the Importance of Cash Flow: The income statement is accrual-based, meaning it records revenues and expenses when incurred, not necessarily when cash is exchanged. Therefore, net income does not always provide a full picture of Microsoft’s cash position.
Reasoning: Cash flow analysis is crucial because it reveals Microsoft’s liquidity and financial flexibility, showing whether it can cover its obligations, invest in new opportunities, and return value to shareholders. High net income but low cash flow can signal issues like high receivables or heavy debt payments, which can impact the company’s financial sustainability.
Financial analysts can avoid common pitfalls and gain a more accurate understanding of Microsoft’s financial performance and position by paying close attention to these aspects and integrating a thorough analysis.
Investor Takeaway
Analyzing an income statement is akin to piecing together a financial puzzle, where each component reveals part of a company’s economic narrative.
Through our detailed exploration of Microsoft’s income statement, we’ve uncovered how to dissect revenue trends, assess gross and operating margins, interpret net income fluctuations, and scrutinize non-operating items and financial ratios.
These analyses are crucial for understanding a company’s financial health and making informed investment decisions.
Mastering income statement analysis offers a window into a company’s soul, illuminating its financial strengths and vulnerabilities.
However, this is only the beginning. To gain a fuller picture of a company’s financial standing, one must also navigate the complexities of the balance sheet and cash flow statement.
As we conclude our analysis of Microsoft’s income statement, remember that the true value of financial analysis lies in its application — empowering you to make informed decisions in an ever-evolving economic environment.
With that, we will wrap up our discussion of analyzing an income statement.
Thank you for reading. I hope you find something of value here. If I can be of any further assistance, please don’t hesitate to let me know.
Take care, and Until next time, stay safe out there,
Dave
