Updated 9/3/2023
“For a fundamental investor, anticipating revisions in expectations is the key to generating attractive returns. Sources of those revisions include fundamental outcomes (typically earnings revisions) and an assessment of how the market will value those fundamentals (multiple expansion or contraction). Investors who are able to forecast earnings in a year’s time that are substantially different than today’s expectations can earn meaningful excess returns.”
Michael Mauboussin
Operating leverage is one of the more important considerations when analyzing a company, but it is one of the more underutilized ideas. The better operating leverage a company owns, the quicker it can scale up as it grows, and the lower the leverage; the opposite is true.
Another benefit to studying operating leverage is seeing management efficiency in action, better management in controlling costs, and focusing on efficiencies across the board will lead to better results.
Keep in mind that each industry will have different degrees of operating leverage. For example, comparing the operating leverage of Apple to GM is not a fair comparison, but comparing Apple to Microsoft is a more reasonable comparison. Context matters, and it is important to keep that idea in mind.
In today’s post, we will learn:
- What is Operating Leverage?
- Why is Operating Leverage Good?
- How Do I Determine Operating Leverage?
- How Do I Calculate Operating Leverage?
Okay, let’s dive in and learn more about operating leverage.
What is Operating Leverage?
Operating leverage, according to Investopedia, is:
“Operating leverage is a cost-accounting formula that measures the degree to which a firm or project can increase operating income by increasing revenue. A business that generates sales with a high gross margin and low variable costs has high operating leverage.”
A company’s operating leverage translates revenue growth into operating income, or EBIT (earnings before interest and taxes). And that leverage also translates into the volatility of the operating income or operations of the company.
Companies with higher operating leverage carry higher fixed costs regardless of whether they do $1 of sales or millions. Low-operating leverage companies may have higher variable, fixed costs but lower fixed costs.
The biggest idea to understand is that operating leverage measures any changes in operating profit related to revenue changes. As revenues scale up, operating leverage should increase profitability. If a company’s sales grow, but its operating income grows at the same pace, its operating leverage is low, and vice-versa.
For example, if a company sells $10 and its operating margin is 50%, its operating profit is $5. But if the company’s sales grow to $20 and the operating margin remains the same, then the company’s profits will scale correspondingly to $10. However, if the company has operating leverage and the operating margin falls to 40%, then the company’s operating profit would grow to $12.
Below is a table we will explore further in the post.
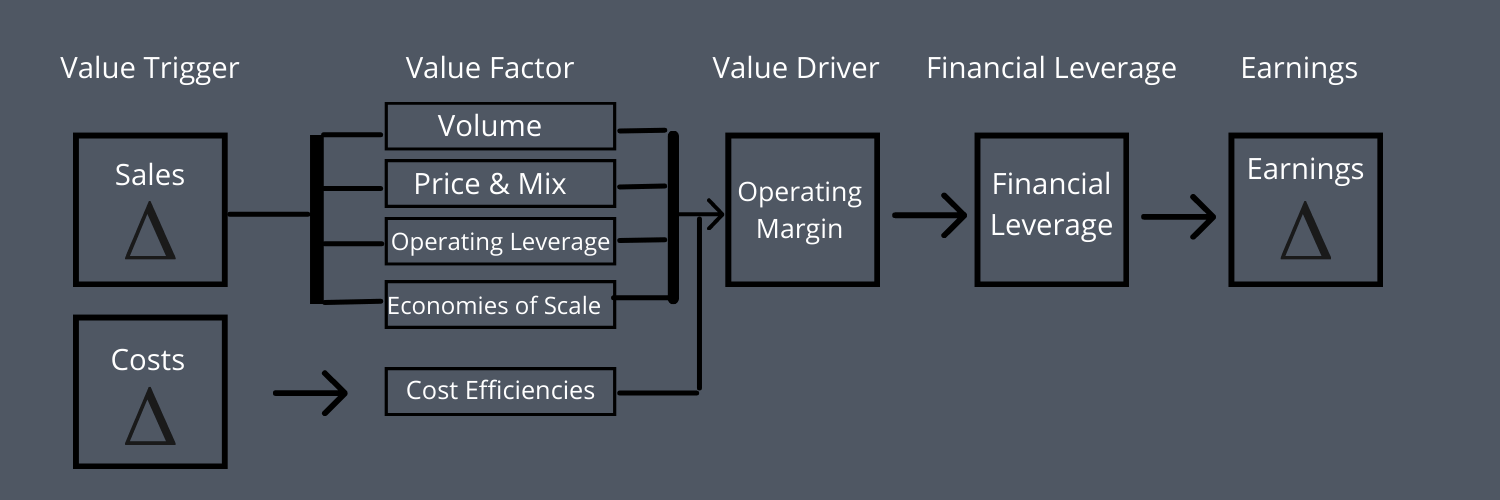
The graph above highlights some changes necessary to produce operating leverage, which we will explore immediately.
The biggest drivers of operating leverage are fixed or variable costs compared to the revenue. The fixed and variable costs equal the total costs a company expends to operate the business. It includes raw materials, inventory, payroll, R&D, marketing, administration, compensation expenses, and commissions.
Other costs included are non-cash items such as depreciation and amortization and stock-based compensation, which the company uses to reduce earnings, even though actual cash doesn’t flow out for those expenses.
The company’s fixed costs are costs they have to pay regardless of sales, such as rent, insurance, and taxes. And when sales fall, these fixed costs don’t move, causing bigger drops in profits. On the flip side, if sales rise, profits also rise. A great example is an amusement park like Six Flags, which has high operating leverage. With over 75% fixed costs and labor occupying the highest cost, when the parks were shuttered during Covid, they lost huge, but the parks will see growing profitability as they reopen.
Variable costs such as commissions flex as revenues rise, and commission expenses rise in tandem. The commissions of a company limit the degree of operating leverage they can bring to bear to improve profitability.
Keep in mind that different sectors have higher fixed costs than others. For example, sectors such as energy, materials, and telecommunications carry high fixed costs because of the nature of their businesses: information technology, consumer staples, and discretionary carry much lower fixed costs.
It is important to understand that all costs are variable in the long run; separating between fixed and variable is a good practice and great to understand. But when companies experience downturns, such as in March 2020, many will have the ability to reduce both fixed and variable costs in response.
Why is Operating Leverage Good?
Using an example is best to explain why operating leverage is good for businesses. My favorite example to explain operating leverage is Microsoft.
Most of Microsoft’s upfront costs, such as research/development and market, are fixed. Whether Microsoft sells one copy of Microsoft Office or ten million, the company’s costs remain unchanged. So, once Microsoft sells enough copies of Office to cover its upfront costs, every dollar afterward drops to the earnings or bottom line.
Microsoft or Apple is a perfect example of a high-leverage operating business.
A retailer like Amazon’s retail segment is the perfect example of a company with low operating leverage. Amazon’s retail segment has a rather low fixed cost level, while the variable costs the segment carries are quite high. Merchandise inventory in Amazon’s retail segment is the highest cost. Each time a customer orders something from Prime, Amazon has to pay for the supply of that product. Because of that, Amazon’s cost of goods sold continues to grow as sales grow.
When analyzing any company, we need to assess the degree of operating leverage the company carries and what impact the rise or fall of revenues will have on profitability.
The degree of operating leverage corresponds with a company’s cost structure, and that cost structure is critical to the company’s profitability.
For example, if a company with high fixed costs, such as a utility, experiences short-term revenue changes, it will struggle because those fixed costs will occur regardless. That increases risk in the event of a fall in sales or makes the company far more volatile.
In contrast, a company with low operating leverage will experience less volatility when revenues change. Companies with higher degrees of operating leverage, like Microsoft, will experience larger changes in profits during revenue changes.
Operating leverage can inform investors about the company’s volatility they are analyzing. For example, companies with high operating leverage can be great and profitable and vulnerable to big changes in business cycles.
In good times, high operating leverage companies can supercharge earnings. Still, companies with costs tied up in machinery, plants, real estate, and networks can’t easily move on a dime and cut expenses.
Operating leverage is not a panacea; it is only part of the equation of analyzing a company.
How Do I Determine Operating Leverage?
Getting to the good stuff now, let’s go back to our diagram from above and dissect how to calculate operating leverage.
Before looking at a formula, let’s explore some of the drivers of operating leverage.
Sales Growth
Sales growth is far and away from the biggest driver of operating leverage and growth of the company. To estimate sales growth, we have a few approaches we can use.
The first idea is matching the economic growth of the economy in which the company resides. For example, as a base rate, most companies in the U.S. will grow at least at the rate of the economy or GDP, which historically ranges between three to four percent.
Of course, some sectors will be more sensitive than others, with consumer discretionary and industrials highly correlated to GDP, while consumer staples and health care are far less correlated.
The second idea, industry growth, is the first resource most analysts choose when making sales predictions. The first thing we must consider is where the industry’s life cycle resides. For example, physical retail stores are in the decline phase of the cycle with the rise of internet retail. Industry growth follows an S-curve, accelerating sales early in the cycle before flattening out. Still, each industry will have different life cycles and growth rates again.
The biggest mistake is forecasting high growth rates when the company or industry is in the middle of the life cycle. Michael Mauboussin gives a great example of color TVs in the 50s and 60s. As the TVs gained more following, the producers added more capacity and accelerated capacity at the top of the S-curve, even as sales flattened.
Changes in market share also impact sales forecasts. Emerging markets tend to be the most volatile but flatten out as they mature. A great example is the cell phone industry; early on, there were great sales and competition, but as saturation started to occur, the great growth companies such as Verizon enjoyed flattened out.
As I mentioned earlier, sales growth is one of the fundamental drivers of value for any company. Still, it is important to realize that sales growth, profit growth, and value creation are unrelated.
Companies only create value when their operating profit exceeds their cost of capital; if those levels match or fall below, it is either destroying or not adding value.
Volume Factors
Next, let’s look at the four value drivers for a company.
- Volume – Sales volume can enhance operating leverage and profitability because of sheer number growth. As volume grows, with operating leverage, profit grows exponentially.
- Price and Mix – Price changes mean the company earns greater sales to sell the same product. For example, if Microsoft raises the price of Office and sells the same amount or more, that increases sales and potential profits. Buffett often argues that the ability to raise prices is one of the greatest advantages a company owns. The price mix encompasses both high and low-profit products or services. As a company moves toward a higher profit mix, its operating leverage grows. Moving toward a higher profit mix allows companies to grow profits even with sales declines.
- Operating leverage – Every company has to invest money before selling a single product, whether labor, raw materials, or research. These preproduction costs lower the front-end profits; think about our Microsoft example. But in the long run, they can be quite profitable.
- Economies of Scale – A company that can perform activities at a lower cost per unit as its volume grows operates at economies of scale. It can include production, purchasing, and distribution, for example. Economies of scale lead to better efficiency as sales volume increases. That efficiency shouldn’t be mistaken for operating leverage, which tends to spread out costs over large sales volumes.
- Cost efficiencies – Companies can reduce costs by improving processes, technology, or training. They can also alter how they produce their product or service. The big issue with cost efficiencies is they have a finite limit. You can only reduce costs so much before it affects the company’s productivity.
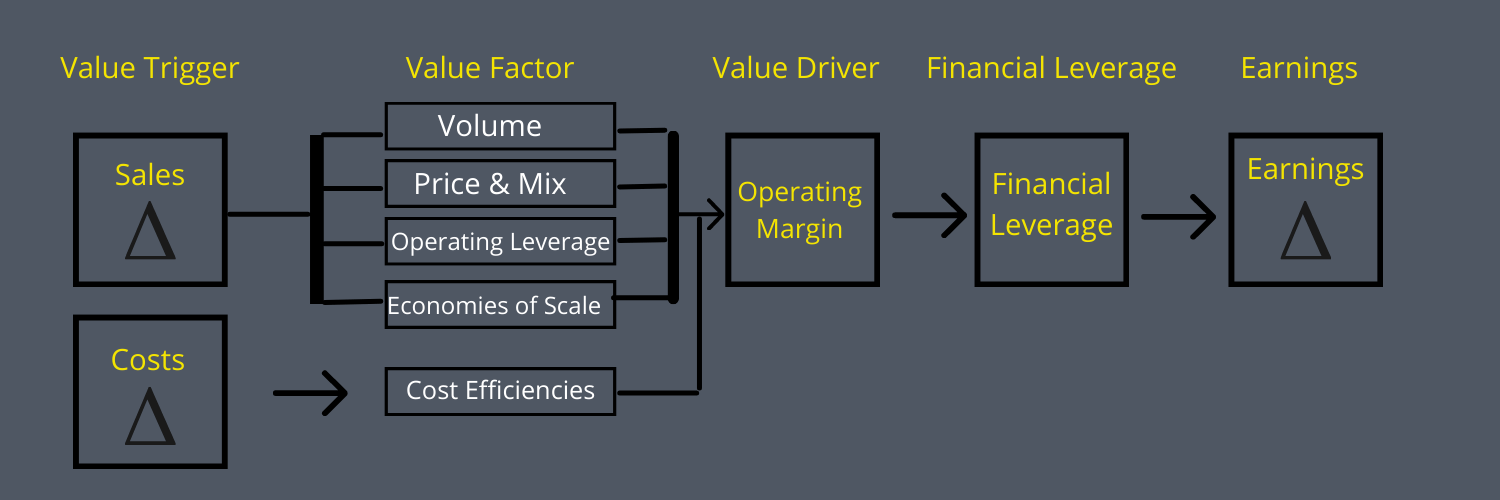
Operating Margins
Operating margins tell investors how efficiently the company creates profits from the business operations. The higher the number, the more efficiently the company operates.
Each industry or sector will have operating margins respective to their particular sector. For example, the operating margins of Costco don’t compare to Visa as they are completely different types of business.
We measure operating leverage by comparing sales changes with operating margins. By comparing companies in the same sector, we can see if our particular company should expect margins to expand or contract as it matures.
Operating margins are the basis of determining the profitability of companies. The numerator in NOPAT (net operating profit at taxes) that we use to calculate ROIC (return on invested capital) tells us how efficiently the company reinvests its assets to grow revenues.
Financial Leverage
The capital structure of a company goes a long way toward determining the operating leverage of the company. For example, a company with a high debt load also has a high-interest expense on the income statement. That interest expense decreases the company’s net income and can be considered a fixed cost.
That financial leverage magnifies changes in operating income. Consider the chart below as an example:
Operating Profit | Interest Expense | Pretax Profit | |
Company A | $150 | $0 | $150 |
Company B | $150 | $30 | $120 |
The higher interest expense creates more volatility in earnings and different values for the company. Debt is a necessary ingredient in a growing business, but the debt load must be in relation to its sales volume. Bigger debt loads lead to higher interest expenses, decreasing operating profits.
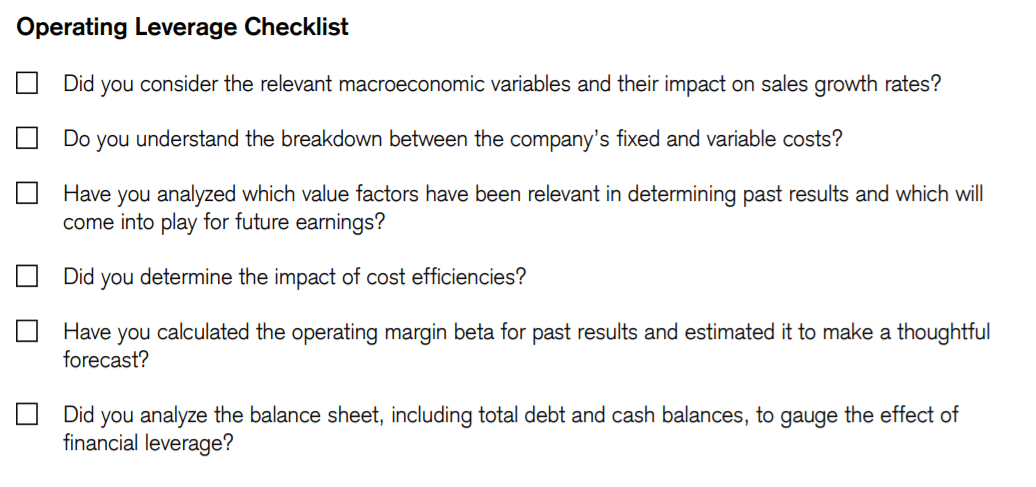
Michael Mauboussin offers a fantastic checklist to consider when considering the operating leverage of any company you are analyzing:
How to Calculate Operating Leverage?
The formula to calculate operating leverage is:
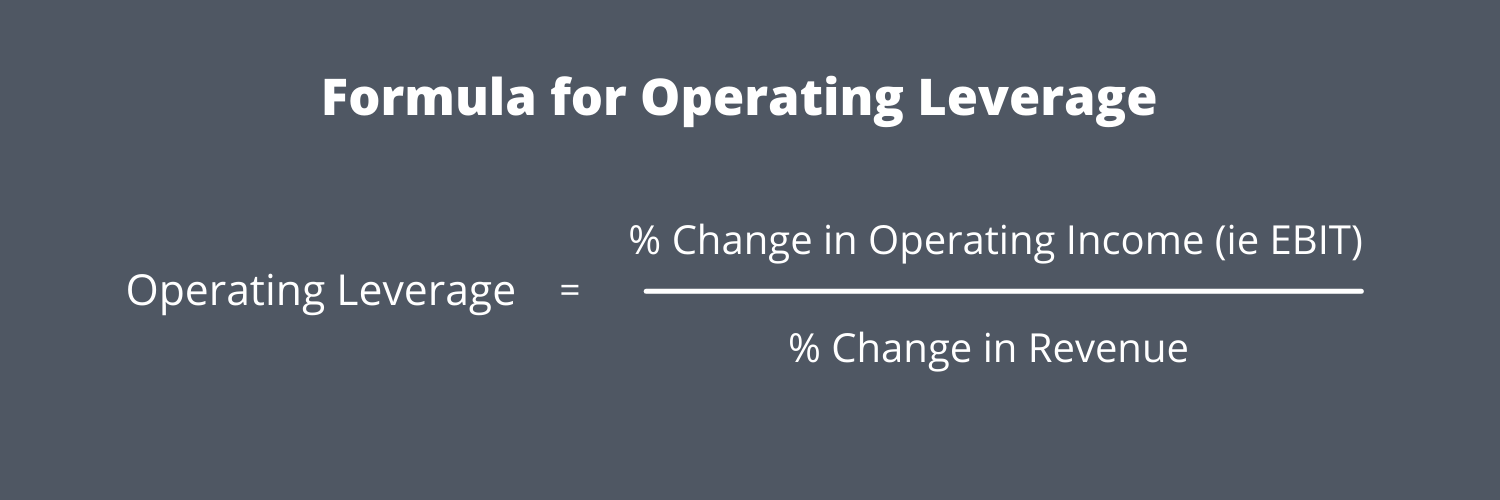
The best way to illustrate the formula is to use a company’s financials to examine operating leverage. We will use Microsoft and their latest annual report dated July 30, 2020, as our guinea pig.
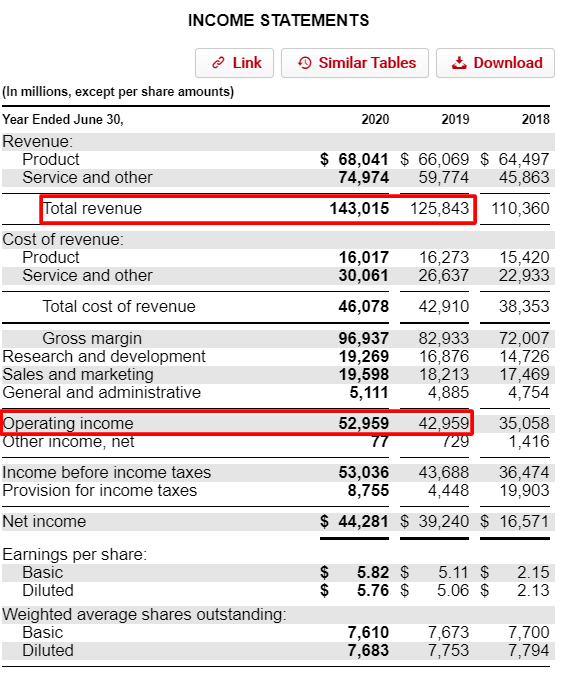
Now, pulling the numbers from the income statement and then determining the change by subtracting the current year from the previous year, and likewise with the revenues, and then dividing it by the previous year’s numbers and then dividing all of that to arrive at our degree of operating leverage.
Below is a chart giving us the change in operating income and revenues.
2020 | 2019 | Change | |
Operating Income | $52,959 | $42,959 | $10,000 |
Revenues | $143,015 | $125,843 | $17,172 |
Now we can calculate the operating leverage, which is:
Operating leverage = ($10,000/$42,959) / ($17,172/$125,843)
Operating leverage = 0.23 / 0.14 = 1.64x
It is a fairly easy formula to calculate once you know what to look for, and to learn more about how this formula works, click the link below:
Degree of Operating Leverage (DOL) – CFA Level 1
The degree of leverage helps us determine how exposed the company is to changes in sales. A great practice is looking at the operating leverage over longer periods, say five to ten years, and comparing Microsoft to others in its industry to get a sense of its position.
Investor Takeaway
Operating margins are the key to a successful company because survival is not an option if the company isn’t producing operating profits at some point in its life cycle. Young companies struggle to get costs under control as they focus on growing quickly to gain market share and stay alive. Once they achieve maturity and sales level, operating efficiency becomes more important.
Measuring operating leverage is an important focus of analysts to determine future profitability as the company grows and determine the variability if the economy turns sour. It helps analysts and investors measure the volatility in earnings and any risk associated with the company.
To learn more about this important subject, check out the two resources that were instrumental to my continuing learning on this subject:
Operating Leverage: A Framework for Anticipating Changes in Earnings
Expectation Investing: Reading Stock Prices for Better Returns
And with that, we will wrap up our discussion on operating leverage.
As always, thank you for taking the time to read today’s post, and I hope you find some value in your investing journey. If I can further assist, please don’t hesitate to reach out.
Until next time, take care and be safe out there,
Dave

Dave Ahern
Dave, a self-taught investor, empowers investors to start investing by demystifying the stock market.
