Updated 2/7/2024
“The possibility of permanent loss is the risk I worry about.”
Howard Marks, The Most Important Thing
Buffett’s rule number one is avoiding the possibility of losing money, and many value investors, including yours, truly subscribe to that idea.
One way to determine the riskiness of stocks in your portfolio is to analyze your asset construction based on their stock correlation.
By looking at your portfolio’s correlation, you can identify too closely related assets, which can hurt your returns if that asset class is underperforming.
When constructing our portfolios, it is always best to invest in stocks, bonds, ETFS, or others that are not closely correlated. Using stock correlation helps avoid total portfolio meltdowns when a particular asset gets hurt.
Many portfolio managers focus more on the assets and diversification than the actual securities. The theory is uncorrelated assets move in opposite directions; for example, bonds do well when stocks perform poorly, and vice-versa.
In today’s post, we will learn:
- What is Stock Correlation?
- What Are the Five Types of Correlation?
- How Do You Calculate the Stock Correlation?
- Why Does Stock Correlation Matter?
- Examples of Portfolios with Stock Correlation
What is Stock Correlation?
Stock correlation, according to Investopedia:
“Correlation, in the finance and investment industries, is a statistic that measures the degree to which two securities move about each other.”
Many advisors use stock correlations in the more advanced portfolios, and the calculations of the stock’s correlation have a value ranging between -1.0 and +1.0.

More on that in a moment.
In statistics, correlation shows the strength of the relationship between two variables. It is expressed as a statistical coefficient.
As mentioned above, the coefficient ranges between -1.0 and +1.0. A correlation coefficient of one equals a perfect positive correlation.
For stock correlations, a perfect correlation indicates that as one stock moves up or down, the other moves in tandem in the same direction.
Likewise, a perfect negative correlation means that two stocks move in opposite directions. Bonds and stocks are thought to have perfect negative correlations.
A correlation of zero implies no relationship at all.
Here are some other examples to help illustrate the point: Large-cap stocks such as Microsoft or Apple generally have a high positive correlation to the S&P 500, or nearly one.
Likewise, smaller-cap stocks such as Akero Therapeutics, Tupperware Brands, and Tootsie Roll positively correlate to the S&P 500, but it is lower, say 0.7, which means that small-cap stocks don’t move in parallel with the S&P 500.
As mentioned earlier, stocks and bonds have a negative correlation. For example, during the first half of 2008, U.S. stocks fell 25%, while Treasuries rose. Following the drawdown, stocks rebounded by 8%, and Treasuries fell during the rebound.
What Are the Five Types of Correlation?
Correlation refers to the method of determining the relationship between two variables. Multiple methods exist for determining the correlation between those variables.
For our purposes, our interests lie in the correlation between two stocks, bonds, or ETFs.
Correlations occur in the world of statistics, and we will dive into that world briefly to find a method for determining the riskiness of our portfolios.
The idea behind portfolio construction is that the less correlated our portfolio is, the less risk involved and the safer our investments.
A stock correlation closer to zero, either positive or negative, implies little or no correlation between them. The closer the coefficients move to a positive one, the closer the correlation to the securities.
A coefficient closer to a negative one indicates a negative correlation between the securities, with the increase in one stock tied to the decrease in the other stock.
There are three types of correlation related to our interests:
- Positive correlation – when the equity value of one security increases concerning the other security
- Negative correlation – when the equity value of one security decreases concerning the other security
- No correlation – when there are zero relationships between the securities
There are four different statistical methods for calculating correlation coefficients:
- Pearson correlation coefficient
- Linear correlation coefficient
- Sample correlation coefficient
- Population correlation coefficient
For our interest today, we will focus on the Pearson correlation coefficient.
The Pearson correlation is the most common coefficient form and uses values between -1.0 and +1.0. As mentioned earlier, the formula considers the unrelated correlation when the values approach zero.
How Do You Calculate Stock Correlation?
Now that we understand stock correlation a bit let’s start to find out how to calculate it.
Using the Pearson Correlation Coefficient, we can determine whether two stocks correlate with each other.
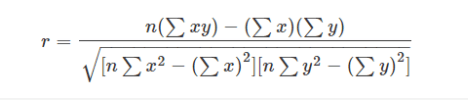
Don’t worry; we will walk through the formula, which is not as ugly as it looks.
Inputs for the formula:
n = quantity of information
∑x = Total of the first variable
∑y = Total of the second variable
∑xy = sum of the produce of the first variable and second variable
∑x2 = sum of the squares of the first value
∑x3 = sum of the squares of the second value
Let’s walk through a simple example to see how this works.
Let’s find the correlation between two data sets, the home run totals of Babe Ruth and Hank Aaron from the age of 29 to age 35.
X equals (47, 60, 54, 46, 49, 46, 41)
Y equals (44, 39, 29, 44, 38, 47, 38)
To find the correlation, we have three steps to follow. The first step is to add up the values of each variable. The next step is to add up Y’s value, multiply each value of x by y, and then add those totals to find their sums.
For example:
SUM(X) equals ( 47 + 60 + 54 + 46 + 49 + 46 + 41 ) = 343
SUM(Y) = ( 44 + 39 + 29 + 44 + 38 + 47 + 38 ) = 279
Next up, the second step:
SUM(X,Y) = (47 x 44) + (60 x 39) + (54 x 29) + (46 x 44) + (49 x 38) + (46 x 47) + (41 x 38) = 13,580
Still with me? Ok, next up is the final step for this round.
For this step, we use each X value, square it, and add up all those values to find the value for SUM(x2). We will do the same with the Y values.
SUM(x2) = (47^2) + (60^2) + (54^2) + (46^2) + (49^2) + (46^2) + (41^2) = 17,039
SUM(y2) = (44^2) + (39^2) + (29^2) + (44^2) + (38^2) + (47^2) + (38^2) = 11,331
We can see from our original data set that we have seven data inputs or n, and we can now plug all our numbers into the formula to find the coefficient for the data set.
R = (7 x 13,580 – (343 x 279) / Square Root (( 7 x 17,039 – 343^2) x ( 7 x 11,331 – 279^2))
All of which equals:
R = -907 / 9644.49 = (0.09)
Ok, now that wasn’t too horrible. The formula looks scary, but the process isn’t too difficult if we follow the steps.
Example with Real Data
Let’s try one using a real data set; how about two companies’ stock prices?
I want to compare the correlation between Microsoft’s and Apple’s stock prices. Let’s use the prices of each company at the end of the last five years.
Microsoft = (68.93 + 98.61 + 133.96 + 203.51 + 206.43) = 711.44
Apple = (38.53 + 56.44 + 55.99 + 115.81 + 110.44) = 377.21
The next step is to sum both Microsoft and Apple:
SUM(Microsoft, Visa) = (68.93 x 38.53) + (98.61 x 56.44) + (133.96 x 55.99) + (203.51 x 115.81) + (206.43 x 110.44) = 62,088.46
In the next step, we will square each price and add those values for each company.
SUM(Microsoft2) = (68.93^2) + (98.61^2) + (133.96^2) + (203.51^2) + (206.43^2) = 116,401.99
SUM(Apple2) = (38.53^2) + (56.44^2) + (55.99^2) + (115.81^2) + (110.4^2) = 33,409.09
Now for the final step, because we have five years of prices, n will equal 5.
R = (5 x 62088.46 – (711.44 x 377.21) / Square Root ((5 x 116401.99 – 711.442) x (5 x 33409.09 – 377.212)) = 42080.02 / 43338.48
R = 0.97
I don’t know about you, that was fun! How interesting to see that before we began that walkthrough, I thought that the stocks would closely correlate, and lo and behold, Microsoft and Apple remain correlated on a price basis.
Okay, the calculations involve a little more math than most would like. So, how do we calculate a portfolio’s stock correlation?
The simple answer is that we use online calculators. We should use a few examples to illustrate the process because it becomes clearer when you understand it.
Here are a few links to some good online calculators I discovered while researching this post.
Stock Correlation Calculator – BuyUpSide
Why Does Stock Correlation Matter?
Correlation is used in portfolio management to measure the correlation between the assets in the portfolio.
Finding uncorrelated assets remains the goal of most financial advisors and many investors. Modern portfolio theory suggests that a portfolio full of closely correlated assets will perform poorly over time.

According to the theory, a portfolio full of assets with less correlation to each other will perform better over time.
Determining correlation tells you the amount of risk you are assuming by holding assets that move in lockstep.
If you diversify your portfolio into uncorrelated assets, you will reduce the risk of permanently losing money in your portfolio, which, if you recall, is Buffett’s number one rule.
A great example of this is the correlation of bonds to stocks, or another example, Disney to Intel. Both of the above examples are unrelated, which in theory means that all things being equal, if one goes down, the other rises.
Now, if there is an overall market downturn, such as during March 2020, all assets drop, with a few exceptions, such as Walmart and Amazon.
Examples of Portfolios with Stock Correlation
Let’s look at a few portfolios to see how closely correlated the assets are.
For our first example, I would like to look at Berkshire Hathaway’s portfolio’s top five positions. Instead of using the formula we calculated earlier, I will use one of the calculators to see the correlations.
Currently, Buffett’s top five positions are:
- Apple (AAPL)
- Bank of America (BAC)
- Coca-Cola (KO)
- American Express (AXP)
- Kraft Heinz (KHC)
I am plugging the tickers into our calculator, which will spit out our correlations and calculate the ratios for three years of monthly returns.
For relation, consider the annualized returns of each position:
- Apple – 29.60%
- Bank of America – 7.50%
- American Express – 5.22%
- Kraft Heinz – (13.14)%
- Coca-Cola – 6.47%
So, after looking through the above chart, we can see that the top five stocks in Buffett’s portfolio are unrelated.
Few are closer to each other, such as Bank of America and American Express, with a ratio of 0.73. Kraft Heinze is unrelated to American Express.
Much of the portfolio is correlated, but I would say mildly, and given that Apple is 49.1% of the portfolio, the less related it is, the better.
Example with Real Data
Let’s try another, shall we?
I want to examine the correlations of Ray Dalio’s portfolio; these are his top five positions:
- SPDR S&P 500 ETF Trust – SPY
- SPDR Gold Trust – GLD
- iShares Trust – iShares Core S&P 500 ETF – IVV
- Vanguard FTSE Emerging Markets ETF – VWO
- iShares Gold Trust – IAU
The three-year returns for each position:
- SPY – 8.91%
- GLD – 9.50%
- IVV – 8.94%
- VWO – 6.70%
- IAU – 9.60%
From the construction of Dalio’s portfolio, we can see that the top five assets are related to the stock portions, but the precious metals or gold are related to each other, not the stocks.
We can make a few observations by analyzing the above snapshots of each portfolio.
First, Buffett’s stock portfolio is the best way to go. He believes that diversifying for diversifying sake is a waste of time.
Second, Dalio’s portfolio is far more uncorrelated between the top holdings, three of the five stocks and the remaining two in gold. As you can see from the above chart, the stocks, and gold are not correlated at any level.
All this tells us that when the markets boom, Buffett will benefit greatly, whereas Dalio will also benefit, but to a lesser degree.
Conversely, when there are market downturns, Buffett will suffer bigger drawdowns on his positions than Dalio, with his gold concentrations uncorrelated to the stock market.
Let’s look at one final comparison to hammer the uncorrelation point home.
Looking at two of the big Vanguard ETFs that hold the stock market and bond markets:
- Vanguard Total Stock Market ETF – VTI
- Vanguard Total Bond Market ETF – BND
The correlation ratios for both ETFs return at 0.04, which tells us that both are uncorrelated.
Final Thoughts
Building an investment portfolio encompasses many different ideas, such as what kind of assets you want to hold, how much risk you want to take on, and how much effort you want to put into the portfolio.
One tool we can use to help reduce our portfolio’s risk is examining the correlations between our assets, particularly the stock correlations.
Stocks tend to have the best long-term returns. However, with those higher returns, we also endure more volatility and a larger risk of losing our investments.
Comparing Buffett’s and Dalio’s portfolios highlights the different ideas for building portfolios. Both are fantastic investment managers and have built portfolios with fantastic returns.
But they come at the idea of asset picking from different places. Buffett believes the stock market is the place to invest, whereas Dalio believes diversification and asset allocation are better.
I believe they are both right. Your choice is based on your beliefs and how much risk you can stomach. Only you can answer that question.
Using stock correlation can help you determine the amount of risk you might take and balance those risks.
With that, we are going to wrap up our discussion for today.
As always, thank you for taking the time to read this post, and I hope you find something of value on your investing journey.
If I can further assist, please don’t hesitate to reach out.
Until next time, take care and be safe out there,
Dave

Dave Ahern
Dave, a self-taught investor, empowers investors to start investing by demystifying the stock market.
