As an investor, it is important to understand how much profit a company generates. However, for a beginner, it can be difficult to determine what definition of profitability to use in your analysis.
Should I use gross profit? Operating profit? Net income? Free cash flow? Adjusted EBITDA? The list of financial metrics is endless, especially considering the non-GAAP profit metrics management teams continue to scheme up.
A straightforward and easy-to-use metric for beginners is the net income margin, otherwise known as the “bottom line.” It can be calculated for every publicly traded company and tells you how much profit it earns for every dollar in revenue it brings each year.
Of course, there are limitations to using net income margin, which we will examine in this article. But for most companies, it is a great starting point for analyzing a stock.
In this post, readers will learn:
- How to calculate net income margin
- What is a good net income margin? (and why that is the wrong question)
- The difference between gross, operating, and net profit margin
- Is net income the same as free cash flow?
How to calculate net income margin
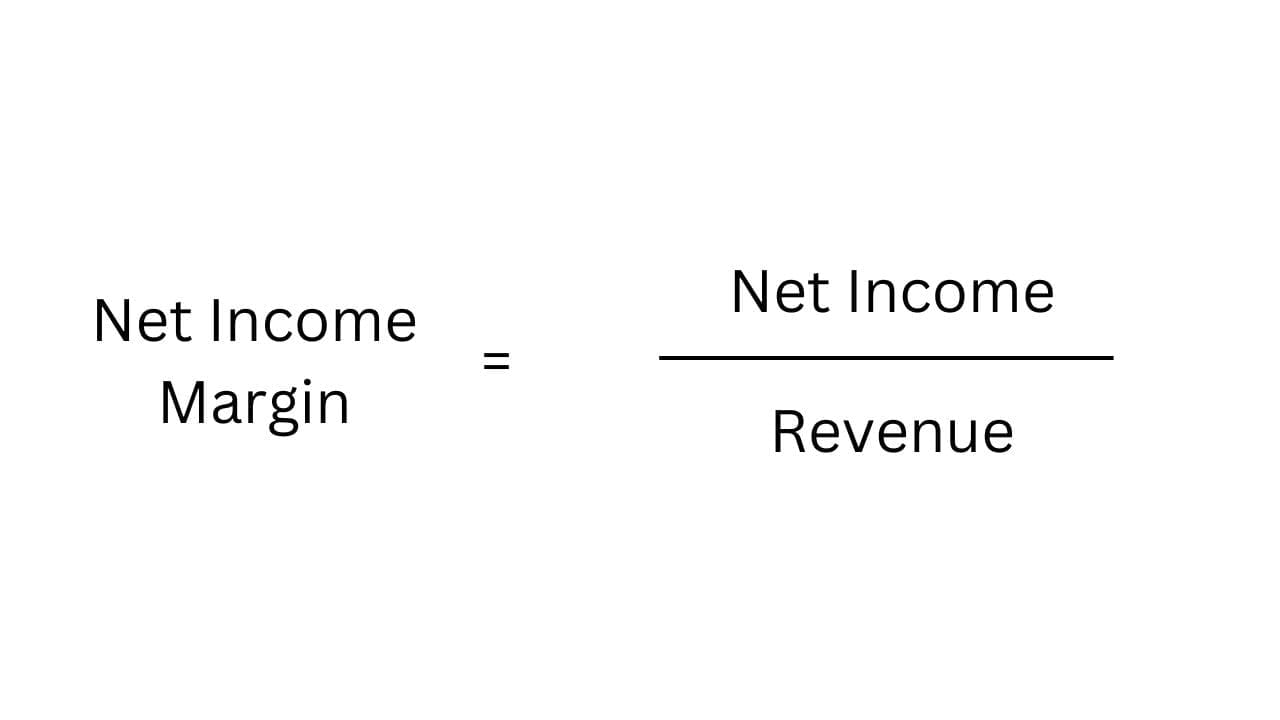
To calculate net income margin, we need two variables: revenue and net income. Both can be found on the income statement of any publicly traded stock.
Finding revenue is easy: it is always the first line item on the income statement. It might be called “net sales” or “total revenue”, but these are all synonyms for the same topline figure for a company.
Below is an example income statement from Apple’s latest fiscal year. As you can see, the company generated over $383 billion in revenue last year and over $394 billion in the prior year.
After finding the revenue figure, we can move on to net income. Net income is always found at or near the bottom of the income statement, sometimes called the “bottom line” figure.
To calculate net income, you take revenue and subtract your cost of goods sold (COGS), total operating expenses, interest expense, and provision for income taxes. When looking at the Apple snippet below, you can see COGS renamed to “Total cost of sales” and interest expense labeled as “other income/(expense), net.”
Net Income = Revenue – COGS – Total Op. Expenses – Interest Expense – Provision for Income Taxes
The one tricky line item for calculating net income is the interest expense, as sometimes it can be interest income. Companies with a lot of net debt will have large annual interest expenses. However, if they have a large net cash position, they will likely earn a lot of interest income that needs to be added back instead of subtracted from operating income when calculating net income.
Example: Apple
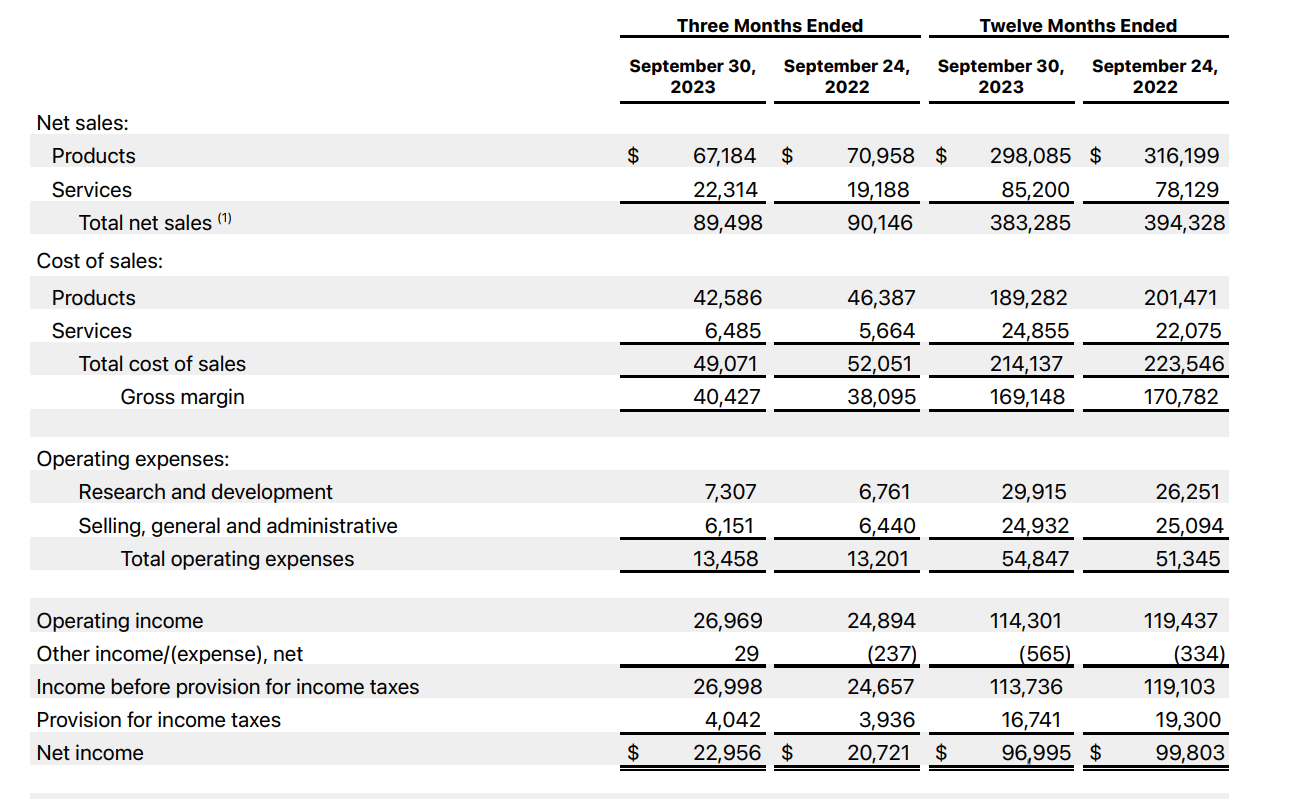
For Apple, we can see that the company generated approximately $97 billion in net income last year and approximately $100 billion the year before.
So, how do you calculate net income margin? Simple. You take your net income for a year and divide it by revenue in the same year. For Apple’s last fiscal year, you take $97 billion and divide it by $384 billion. To obtain a percentage, you multiply the number by 100. For Apple, it had a 25.3% net income margin in fiscal year 2023. In 2022, it had a net income margin of 25.4%.
Comparing net income margins across years can tell you whether a company’s profit margins are rising, falling, or stable. Apple’s net income margin has been remarkably stable over the past two years.
Still confused? Try calculating the figures again with a different business. It is best to visit a stock’s investor relations website and find the income statement yourself.
Many financial data services will calculate your net income margin. This is fine to use once you have more experience. However, as a beginner, it is essential to understand the direct relationship between revenue, expenses, and net income margin.
What is a good net income margin? (and why that is the wrong question)
The S&P 500 – an index of 500 large businesses incorporated in the United States – had an average net income margin of 11.4% over the last five years. For every $100 in revenue the collective S&P 500 companies bring in, $11.40 shows up on the bottom line as net income.
Technically, a company with profit margins above 11.4% is better than the market average, while one below 11.4% is worse than the market average. But this does not necessarily give you great insight into whether a business is good or bad.
Visa is one of the highest-margin businesses in the world, with a net income margin above 50%.
Costco is one of the lowest-margin businesses in the world, with a net income margin below 3%.

Both of these are great businesses with strong competitive moats. Visa’s moat allows it to earn a high margin, while Costco’s moat comes from its strict adherence to selling products at razor-thin margins.
If you are researching a company, it is better to ask questions such as:
- Why is the net income margin where it is today?
- How much could the net income margin expand in the future?
- How likely is it that the net income margin will contract?
These types of questions will (hopefully) give you insight into a business’s net income margin when you own the stock. Understanding the future trajectory of a company’s net income margin can help you estimate its future profitability, which in turn will drive stock performance.
The relationship between gross, operating, and net profit margin
Predicting a company’s future net income margin is vital for performing stock analysis. To do so, one must understand the relationship between gross profit, operating profit, and net income.
As mentioned above, gross profit is calculated by taking revenue and subtracting COGS. These variable costs typically scale with a business as it gets larger. You get gross margin by dividing gross profit by revenue, similar to net income margin.
A high gross margin indicates that a company has a high net margin ceiling, while a low gross margin means a low net margin ceiling. However, it doesn’t necessarily mean the net income margin is high—or even positive—right now.
Operating profit is calculated by taking your gross profit and subtracting your operating expenses (hence the name “operating” profit). These expenses include corporate office costs, research and development, and marketing. Operating margin is calculated by taking operating profit and dividing it by revenue.
Operating profit tells you how much a company earns before considering financial obligations like interest expense or taxes and is the next step after gross profit on the income statement.
These are all profit metrics taken at various points along the income statement. A high gross margin indicates a capability to achieve a high operating margin and, subsequently, a high net income margin. A wide gap between operating margin and net income margin suggests a large amount of debt on the company’s balance sheet or it operates in a country with high tax rates (or both).
Examples: Visa and Costco
Let’s use Visa and Costco as examples again to illustrate these relationships.
Visa’s gross margin is close to 100%, as every transaction across its payments network has close to zero costs. This has been true since the company became a publicly traded stock and likely long before that.
When Visa first went public 20 years ago, its operating margins hovered in the 30%—40% range, a wide gap from its gross margin. Smart investors at the time could predict that Visa would likely expand its operating margin as the business scaled.
And this is indeed what happened. Visa’s operating margin is now above 60%. With low debt levels, Visa’s net income margin followed suit and now sits above 50%, a key driver of its stock outperforming the market since going public. Its net income margin will likely always be lower than its operating margin because of its annual tax payments.
Costco’s gross margin is just 12.6% and has remained low for its entire corporate history. It is unsurprising that its operating margin sits at a 3%—4% range. Unless there is a reason to expect Costco’s gross margin to start rising, no rational investor would expect operating margins to rise significantly from here. The math doesn’t work.
Like Visa, Costco has low net debt levels but does pay taxes, which leads its net income margin to fall in the range of 2% – 3%. It could rise and has risen a small amount since Costco went public, but expecting a 10% net income margin in the future would be a foolhardy prediction for any investor.
Net income and net income margin are what matter most. However, investors need to use gross margin and operating margin to make insightful predictions about where net income margin can head in the future.
All the items on the income statement are related. As investors, our job is to put the pieces of the puzzle together.
Is net income the same as free cash flow?
The final connection beginner investors need to make is the relationship between net income and free cash flow. These are two standard measures of profitability that can tell a lot about a business.
We already understand net income and net income margin. They are the audited measure of profitability by the accounting standards of the country where the company is headquartered. For the United States, these are known as GAAP—generally accepted account principles—metrics.
On the other hand, free cash flow measures the actual cash flow accumulating on a company’s balance sheet. See, net income estimates profitability, sometimes including non-cash charges such as depreciation, stock-based compensation, and goodwill impairments. However, these expense estimates don’t drain cash from a company’s balance sheet, making them difficult to value, which is why free cash flow can be a useful tool for investors.

To get from net income to free cash flow, an investor moves from the income statement to the statement of cash flows. The statement of cash flows begins with net income and then adjusts this profitability metric by balancing the true cash flows to and from the balance sheet in the year. It sounds complicated, but every company must make these calculations for you. After adding and subtracting all these adjustments, you end up with what is known as operating cash flow.
An investor takes this operating cash flow number and subtracts out any capital expenditures made in the year to get to free cash flow. You might see capital expenditures called “purchase of property and equipment.” These are interchangeable terms.
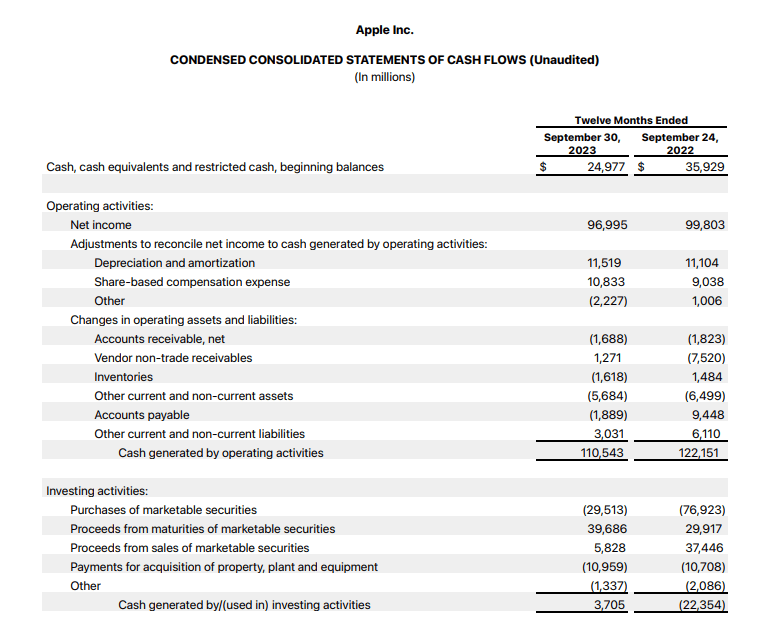
Example: Apple
Let’s clear things up with our Apple example again. Below, you can see the top half of the cash flow statement for fiscal years 2023 and 2022. It starts with net income and then moves through all the cash adjustments to net operating cash flow, with $110 billion in 2023 and $122 billion in 2022.
Finally, an investor can take this operating cash flow figure and subtract out capital expenditures to obtain free cash flow. In 2023, you had $11 billion in capital expenditures, bringing Apple’s free cash flow to $99 billion.
A useful comparison is the net income margin to the free cash flow margin. The free cash flow margin is calculated by dividing free cash flow by revenue.
A business with free cash flow margins below net income margin is said to have low cash flow conversion. A business with high free cash flow margins compared to net income margin is said to have high cash conversion.
In fiscal year 2023, Apple had a 25.3% net income margin and 25.8% free cash flow margin, giving it solid but not outstanding free cash flow conversion. Over the long run, you want businesses that convert more of their profits to cash flow, all else equal. This makes free cash flow conversion an important metric for investors to track.
Conclusion
Overall, net income margin is a useful tool for estimating a company’s profitability, and all investors need to understand it. However, savvy investors know it shouldn’t be used in a vacuum. More importantly, the net income margin relates to all the different items on a company’s financial statements and how one can use it to predict future profit generation.

Brett Schafer
Brett Schafer is an investor, host of the Chit Chat Stocks Podcast, and writer at the Motley Fool.
