Investors are inherently predicting the future. Whether with an individual stock or a basic index fund, deciding to park your savings in a financial asset means you are making a bet about the future value of that asset. Otherwise, why would you buy it?
Suppose you treat stock analysis as no different than analyzing a business. In that case, you are predicting the future cash flow a company will generate for shareholders relative to the price you pay today. Estimating future cash flows can help you decide whether a stock is overvalued or undervalued. More specifically, you want to estimate the present value of all these future cash generation.
But what is the present value of all the future cash flows of a business? How do you even calculate this? This is where the discounted cash flow model comes in, a popular valuation technique used by investors and the topic of today’s article.
In this post, we are going to learn:
- How to Build a Simple Discounted Cash Flow Model
- How to Use a DCF to Value a Stock
- The Importance of the Discount Rate and What it Tells Investors
- The Limitations of DCF Models
How to Build a Simple Discounted Cash Flow Model
A discounted cash flow model is just that: an estimate of the future cash flow a business will generate while discounting every year back to the present day.
Advanced investors may build discounted cash flows (DCFs) with dozens or even a hundred variables. These models can be math-intensive, discouraging people from trying to learn the techniques. We don’t want to overwhelm investors just learning about a DCF, as it is a useful tool that anyone can use to improve their stock-picking skills. So, let’s keep things simple.
Luckily, these complicated models are not necessary to build a discounted cash flow model (in fact, they may be counterproductive, but that’s a topic for another post). At the end of the day, you need a few variables:
- The company’s current annual free cash flow generation
- Your estimate for the annual growth of this free cash flow
- Your discount rate back to today’s dollars
- The length of time you want to run your DCF

That’s it. If you have these four variables, you can calculate a DCF for any company.
Example: Microsoft
Let’s review a basic example to see how it works with Microsoft. For our variables, let’s assume:
- The company generated $100 in cash flow last year
- Annual free cash flow grows by 10% each year
- A 5% annual discount rate
- 10 years of cash flow
Side note: most investors will include a terminal growth rate that runs in perpetuity in their calculations to value a stock more precisely. Today, we will stick with a 10-year time frame so you can first learn the basics, as terminal rates add in some complications. For anyone interested in learning about terminal growth and terminal value, check out our article on the topic.
To calculate this hypothetical DCF for Microsoft, you first apply a 10% compound growth rate to $100 for 10 years. That means you get $110 in cash flow in year one, $121 in year two, and so on (values included in column one below). Or, in Excel, multiply the next row by 1.1.
Then, for each year, you need to apply a 5% compounded discount rate, giving you a multiplier for each year’s nominal cash flow value that discounts the value back to today’s dollars. To do so, you take the number 1 and divide it by 1.05, compounding for each successive year. So for year one, you get a multiplier of 0.9524, then 0.9070 in year 2, and on it goes (values in column two below).
Finally, you multiply the nominal cash flow value from each year by its discount multiplier to get the present value of each year’s cash flow. In the table below, column one is multiplied by column two, with the output in column three. You add the values together to get the total present value of these 10 years of cash flow.
| Year | Cash Flow | Discount Rate | Present Value |
| 1 | $110 | 0.9524 | $104.76 |
| 2 | $121 | 0.9070 | $109.75 |
| 3 | $133.1 | 0.8638 | $114.97 |
| 4 | $146.41 | 0.8227 | $120.45 |
| 5 | $161.05 | 0.7835 | $126.18 |
| 6 | $177.16 | 0.7462 | $132.19 |
| 7 | $194.87 | 0.7107 | $138.50 |
| 8 | $214.36 | 0.6769 | $145.10 |
| 9 | $235.79 | 0.6447 | $152.02 |
| 10 | $259.37 | 0.6140 | $159.26 |
| Total: | $1,303.18 |
There you have it, a basic discounted cash flow model.
Luckily, today, we don’t have to perform these ten calculations by hand. Numerous websites such as this one will perform DCFs for you at the click of a button. You can also build custom DCF calculators in Microsoft Excel or Google Sheets to suit your needs.
After inputting our four variables from above, we get a present value of approximately $1,303 for our hypothetical Microsoft company (in reality, Microsoft generates billions of dollars in cash flow each year).
Of course, Microsoft will likely operate for longer than 10 years into the future. Still, this DCF is telling us our estimate for the present value of Microsoft’s cash flows over the next 10 years using our growth and discount assumptions.
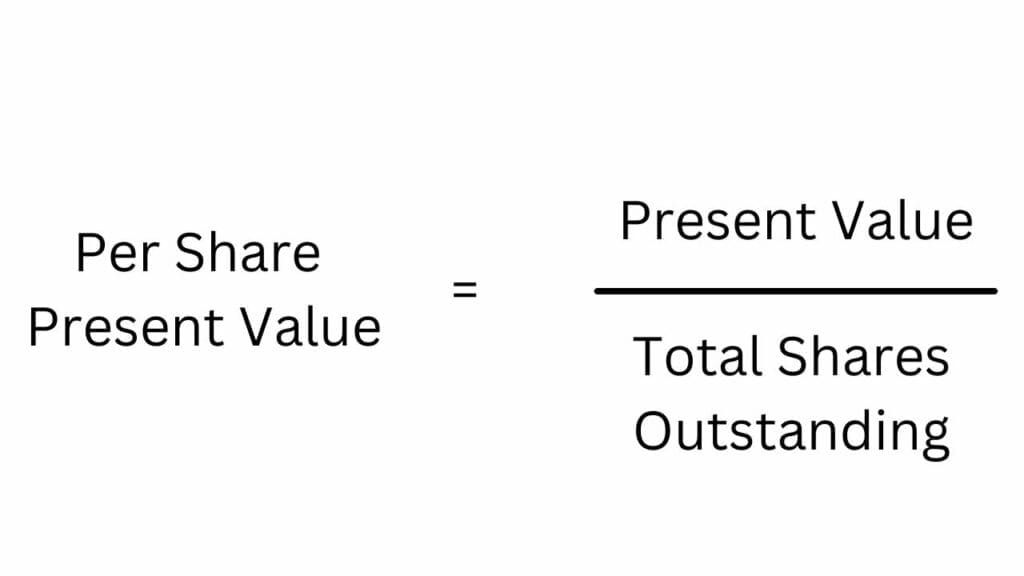
The final step is to evaluate your estimate of intrinsic value on a per-share basis, which tells you your own estimate of the value of the stock today. In our above example, Microsoft has a present value of approximately $1,303. If the company has 100 shares outstanding, then the present value of each share is $1,303 divided by 100, or $13.03 per share.
A DCF estimates – according to your own assumptions – the value of a stock.
If you are still confused, try calculating a DCF using different variables. Or try it with a real company such as Apple or Amazon using their financials. It takes practice to understand the ins and outs of the DCF model fully; you won’t perfect it in a day.
How to Use a DCF to Value a Stock
While building your first DCF might take time, it is easy to use its output to value a stock. If, on a per-share basis, your DCF spits out a value close to the business’s current stock price, it is fairly valued. If it is significantly above, the stock may be undervalued. If it is below, the stock may be overvalued.
Let’s repeat this for clarity, as it is vital for informing an investor. If the per-share present value estimate from your DCF is:
- Close to the current stock price? The stock is close to your estimate of fair value. This means that your estimate for future cash flows (in our scenario, over the next 10 years) is around what investors are paying for the stock today.
- Well above the current stock price? Then shares may be undervalued, making them a buy.
- Well below the current stock price? Then shares may be overvalued, and you might want to sell or avoid buying.
Of course, investing in the real world has more nuance and uncertainty. This brings us to focus on the discount rate, your most important decision when building a basic discounted cash flow model.
The Importance of the Discount Rate and What it Tells Investors
The discount rate is the most opaque variable in the DCF, but it can greatly affect the present value the model spits out.
But what even is the discount rate? Its name is a bit misleading. While it technically is discounting the cash flow from each future year estimate, the discount rate is essentially your forward return estimate for the stock. The higher the discount rate, the lower your present value will be. Inverting this equation, the lower your per-share present value, the higher your forward returns will be, all else equal.

Of course, the actual stock may be trading at a wildly different spot than your present value estimate, which we discussed in the above section, and should inform your buy, sell, or hold decision.
Changing the discount rate can significantly change the output of your DCF model. If we change the discount rate of our above Microsoft scenario to 10%, the per-share present value is $10 for the next 10 years. That is only 77% of the $13.03 per share value we got using a 5% discount rate. If we change the discount rate to 15%, the per-share value is just $7.89.
Investors will use wildly different discount rates depending on their risk tolerance. Some use the interest rate on 10-year U.S. treasury bonds (currently 4.2%, for reference), others use the long-run returns from the U.S. stock market of ~10%, while others may go even further to 15% or 20%. There is no right answer; it is up to every investor to decide for themselves.
The Limitations of DCF Models
Discounted cash flow models can be helpful, but they are inherently flawed. Why? Because they try to predict an unpredictable future precisely.
In our Microsoft example, we said its free cash flow would grow by 10% each year. Who’s to say it won’t grow by 5%? 15%? Or not even grow at all? We can use historical data, management guidance, and our understanding of Microsoft’s business to predict future cash flow. But to estimate its cash flow 10 years into the future down to the decimal point? That is an exercise in false precision.

The stock market is a dynamic arena of competitive groups (i.e. businesses) trying to win the allocation of dollars in our global economy. Given the multi-variate nature of our global economy, there are very few of these businesses – if any – where you can precisely predict their future cash flow.
Some investors may never explicitly build DCF models. In fact, legendary investor Warren Buffett says he has never actually made one. But he is still estimating the future cash flows of a business and weighing that estimate vs. the price he can pay for the stock at today’s price. He just might be doing it in his head.
At the end of the day, you don’t have to build a complex DCF model for every stock you look at. What’s important is that you understand that stock returns for buy-and-hold investors come from the cash flow a company generates for shareholders. In fact, I might argue it is the most important thing you will ever learn as an investor.

Brett Schafer
Brett Schafer is an investor, host of the Chit Chat Stocks Podcast, and writer at the Motley Fool.
