Value Factors – what the heck are they? In the book ‘What Works on Wall Street’ by James O’Shaughnessy, he has an entire chapter (Chapter 10 – you should read it!) dedicated to the ‘Value of Value Factors’ so let’s dive in!
Value Factors are where you’re looking for different factors that might identify a stock that is potentially undervalued, therefore being a very key belief of value-investing.
Some of the more popular factors would be the Price/Earnings (P/E) ratio or identifying a higher than normal dividend yield, but O’Shaughnessy has found that when you only look at these two value factors, you’re actually much more likely to underperform the market.
Instead of looking at P/E and dividend yield, you should be focusing on other value factors such as finding a low Price/Book (P/B), a low Price/Cash Flow (P/CF), or a low Price/Sales (P/S or PSR) ratio.
Throughout O’Shaughnessy’s research, these three factors are all much more likely to lead you to be a more successful investor than if you would focus on some of the typical factors for identifying an undervalued stock.
When I was reading Chapter 10 in What Works on Wall Street, I couldn’t help but think about how much we focus on having a contrarian view when it comes to investing. Value-investing in itself seems to be contrarian if you’re watching CNBC and they’re talking about a ‘final trade’ or options trading, but you can even be the contrarian when it comes to value-investing in itself.
Challenge the status quo!
Don’t just decide to be a value-investor and then do what everyone else in the value-investing community does – do your own thing! This doesn’t mean be reckless; it means to go back and play that devil’s advocate card and try to question things and see if there’s a better, more effective way to be value-investing.
Andrew had Tobias Carlisle on his podcast to talk about the importance of zigging when others zag and if you haven’t had a chance to listen, I highly recommend that you do.
If you’re curious who Tobias Carlisle is, let’s just say he made the cut for our ‘Super 6 Deep Value Investing Thought Leaders’ and I recommend you check him out!
Below is a graph that I took directly from the What Works on Wall Street book and I think it really shows some of the principals that O’Shaughnessy is talking about. He essentially took the Top 50 stocks of each of the following categories, assumed that he invested $10,000 into them on 12/31/1951 and then compared them against each other for how they would look on 12/31/1994, a mere 43 years later.
The different value factors that he assessed were:
- High Yield (dividend)
- High PSR
- Low PSR
- High P/CF
- Low P/CF
- High P/B
- Low P/B
- High P/E
- Low P/E
- All Stocks (think of this as the index or benchmark)
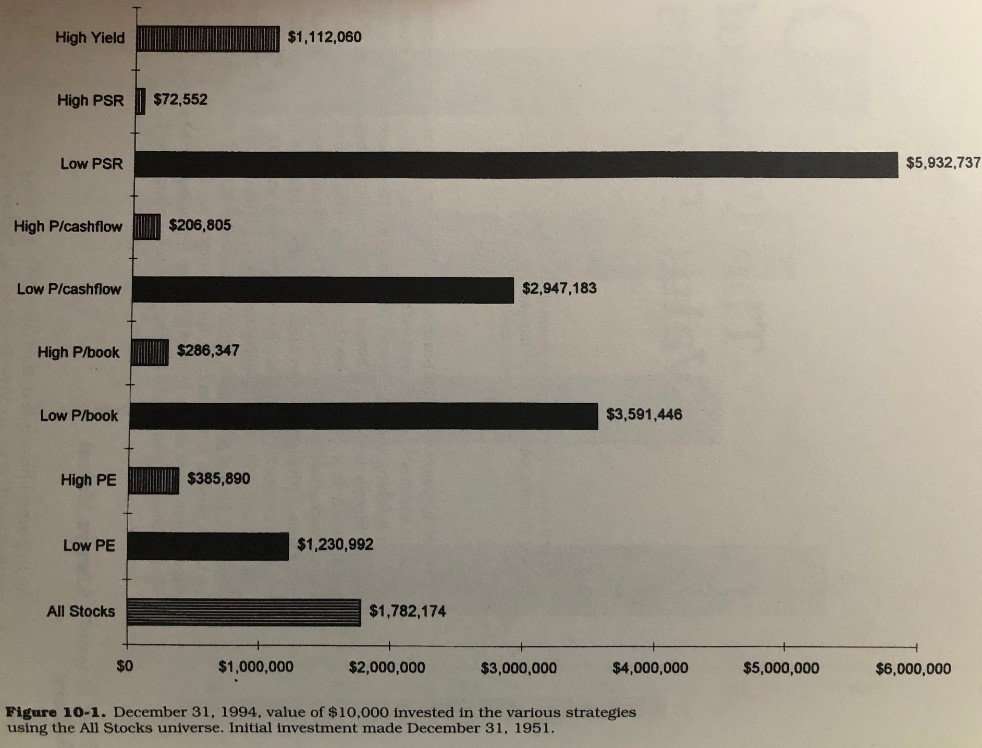
As you can see, the best performed, by far, was looking at the lowest PSR. The next best performed was the Low P/B, which performed more than twice as well as the ‘All Stocks’ benchmark and third was the Low P/CF which you would still be ecstatic with those returns.
As you can likely imagine, the worst performing stocks were the nearly the inverse of those, starting with High PSR being the worst, then High P/CF and then the High P/B.
Also, important to note that following the Low P/E and the high dividend yield, as is the “lazy value-investing methodology” as I’m now coining that term, underperformed the benchmark.
O’Shaughnessy also went through and did this same analysis but only with Large Stocks and it’s important to note that the results are not necessarily the same, so that the same process shouldn’t necessarily be used. He evaluated the exact same categories that he did in the ‘All Stocks’ comparison and received the following results:
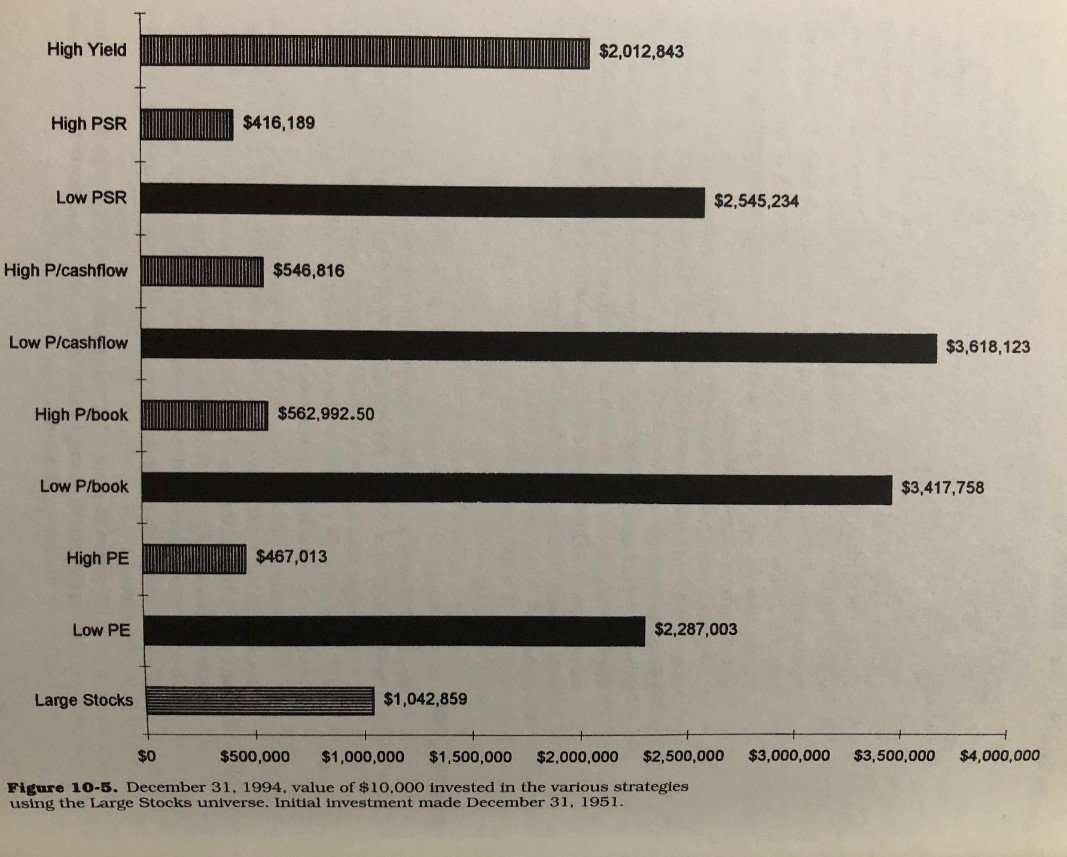
Note that the three main areas of focus (P/B, P/CF, P/S) all performed very well but the Low P/E and the high dividend yield out-performed the market as well!
Something that stood out to me was that the ‘All Stocks’ Benchmark significantly outperformed the ‘Large Stocks’ Benchmark as it finished the 43-period at $1,782,174 vs. the Large Stocks value of $1,042,859 – that’s a huge amount to leave on the table.
If you were to somehow search my mind for the most popular thoughts I bet that Compound Annual Growth Rate, or CAGR, is right up there! CAGR essentially is a measure for how a stock would grow on an annual basis.
So, as you can imagine, when I got to the end of Chapter 10 and I saw this chart showing the CAGR for these different groups that O’Shaughnessy evaluated, I was stoked!

So why do I like CAGR so much? Well, I think that it gives a better look rather than just getting a total value at the end of a certain time period like O’Shaughnessy has shown above.
For instance, in a 10-year period, you could underperform the market 9 years and then that 1 other year absolutely went insane and now you’ve outperformed the market over the past decade because of it.
That’s great, but is it repeatable? If so, great. If not, and I imagine it’s not, it’s important to look at CAGR to get a better feel for what’s actually expected.
A few things that stuck out to me in this chart:
- All Stocks
- Low P/E hasn’t outperformed the market since the 1970s (remember this only goes through 1994)
- Low P/B and P/S consistently outperformed the market since the 1960s
- Yield, shmield. Don’t ignore the yield, but don’t expect it to carry your way to outperformance
- Large Stocks
- Benchmark underperformed the ‘All Stocks’ Benchmark every decade except the 1980s…wow!
- Low P/B is better than ‘All Stocks’ Low P/B as of recent
- Yield, stealed! High Yield is a steal (yes, I know stealed isn’t a word, but I had to rhyme!) compared to benchmark
Overall, I think that O’Shaughnessy has given us some great insight and data on this Chapter and we need to take it to heart. I know that I now feel better equipped for my personal value-investing strategies and I can personally guarantee that I am going to open up a stock screener within 5 seconds of finishing this article!
