If you recently read my post about the different value factors then you’re in the right place to take that knowledge and build on it with some multifactor model discussion from Chapter 16 of ‘What Works on Wall Street’, written by James O’Shaughnessy.
If you haven’t yet read that article, then I highly recommend you start there because a lot of information in this post is going to build off of the foundation that was built previously.
In my previous post, I talked about finding some ways to identify undervalued stocks that are less popular than simply looking at Price/Earnings (P/E) and a high dividend yield, such as Price/Book (P/B), Price/Sales (P/S) and Price/Cash Flow (P/CF).
If you can do this, you’re likely going to experience some great returns. But, what if you potentially can combine a few of these different factors together to run a multifactor model that might find an even more prestigious group of stocks? For instance, take a look at the example below that O’Shaughnessy describes in his book, ‘What Works on Wall Street’.
O’Shaughnessy decided to evaluate stocks that only have a P/E ratio below 20 (which is also what Benjamin Graham recommends) and then he looked for the best 1-year price appreciations in stock price.
He did the same thing again in the last column, but instead of a P/E ratio, he looked for stocks with a P/B under 1 and then took the best 1-year price appreciation in stock price. The results are stunning!
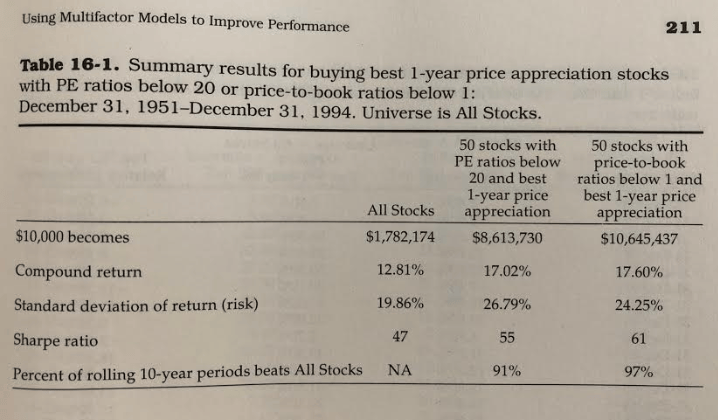
It’s pretty apparent that both of these groupings really outperformed the market by a huge amount! The P/E grouping resulted in a value that was 483% better than the ‘All Stocks’ benchmark while the P/B grouping was even better, sitting at 597% better than the benchmark. Holy crap.
Similar to some of the trends we saw in Chapter 10, if you did this same exercise with Large Stocks only, the returns were good, but not as great as they are with All Stocks.
On average, using these strategies will generally result in you beating the market. During this 43-year period that O’Shaughnessy evaluated, these multifactor strategies will outperform the market on 27 of the 43 years and if you compared it on a rolling 5-year period, the outperformance would be 33 of the 39 times while outperformance would be 33 of the 34 rolling 10-year periods.
What this tells me is that this is a great plan for long-term success.
I don’t know if I’ve ever read anything that’s more convincing than that in my investing life. Value-investing and long-term investing really should go hand in hand with one another and this is picture perfect proof as to why.
The same exact strategy is only successful 63% of the time on an annual basis, but it’s successful 97% of the time when evaluating it on a 10-year look! That is insane. A couple lessons to take away:
1 – Don’t focus too much on a small period of time if you’re a long-term investor. Long-term investors with short-term goals create a recipe for underperformance.
2 – Stick to your analysis. If the fundamental analysis of the company hasn’t changed, then you shouldn’t sell the stock. If the stock price goes down but the fundamentals are the same, then you should be viewing it as a “clearance” and maybe you can buy some more at a discounted price.
We’ve been talking a lot about value-factors, but you can use growth factors as well – but beware, you’re likely going to experience more volatility and less consistency.
An example of this would be if you used a large positive earnings growth as one of your multifactors in your modeling.
Below is another table that O’Shaughnessy uses to show how stocks have performed when looking at a P/S (PSR) under 1 and then taking the best 1-year relative strength:
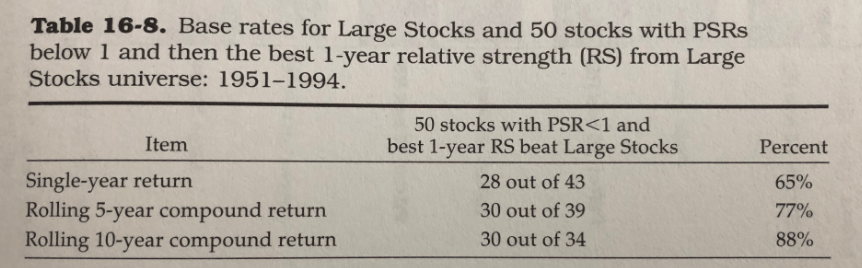
Again, the annual numbers are good, but notice how they keep growing in the percentage that they outperform the benchmark based off how long you’re willing to hold onto them. That should be a major indicator for you!
I really, really recommend that you go out and buy this book if you can spare it. It is somewhat expensive at right around $30 but this is truly the best investing book that I have ever read.
I think O’Shaughnessy does a fantastic job at explaining things and does so in a very easy to understand way. If you have read investing books before, you know that the author can tend to get in the weeds and make things hard to understand – O’Shaughnessy doesn’t do that.
He will explain the concept to you and then prove his point with a lot of data and graphs. If you’re someone that learns by analyzing numbers, like me, then this book was meant for you, but don’t take that to mean that these graphs are overly intimidating.
I mean, look at the two charts I’ve included in this article – pretty simple to understand, right?
I mean, to put it in perspective, in this 17-page chapter, O’Shaughnessy included 12 charts…
In summary, using multifactors are going to help you get a much stronger result. It’s like if you were to try to get the 10 smartest high school kids together…would you simply say, “I want the 10 kids with the best GPA” or would you say, “I want the 10 kids with the best GPA AND an ACT score > 33?”
I would add in the ACT because it’s simply one more condition that has to be met that should help get you what you’re actually after – the smartest kids.
That’s the type of mentality that you should use with investing, too. Don’t be afraid to get selective and only look for the best of the best. You can use a stock screener like finviz to help you identify which stocks meet your desired criteria.
Be prestigious!
Find exactly what you need and don’t relax your requirements just to find a stock.
