U.S. stock market valuations are beginning to excite me again after this year’s fall of 15.3% from 52-week highs. Even more so, developed markets across the globe are all hurting in the rising interest rate environment with valuations that compare favorably to U.S. markets as this article will explore.
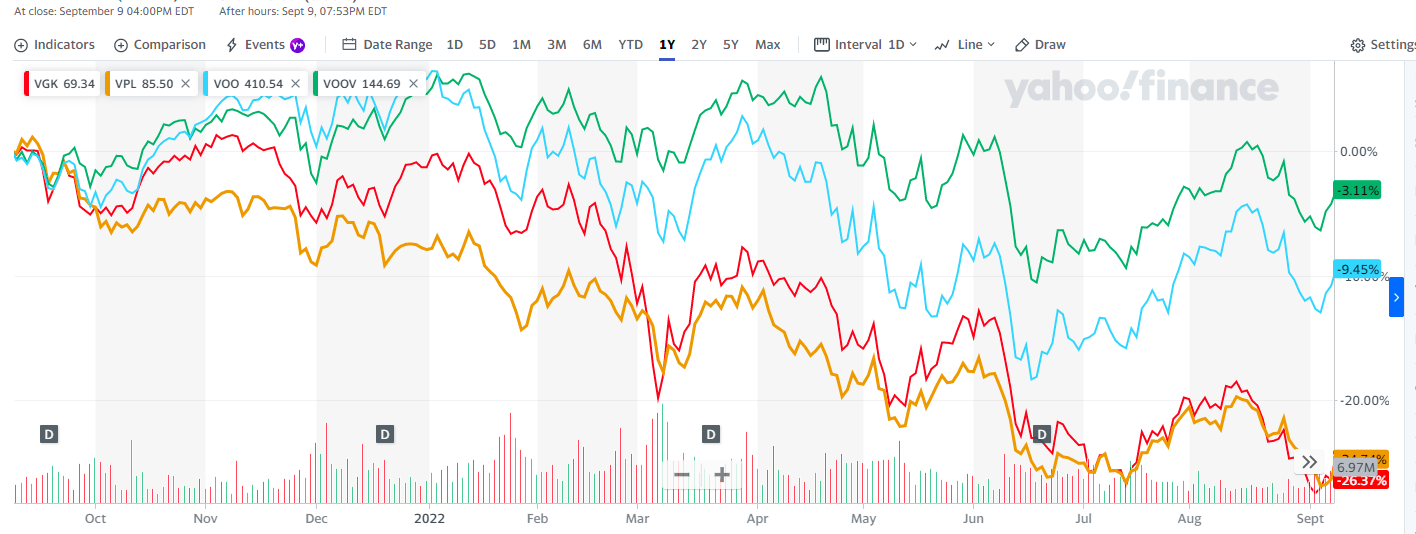
Broad European indices trade at 11.6x P/E and the developed Pacific at 11.9x P/E. Both European and Pacific markets are down from 52-week highs by 25.4% and 25.6%, respectively. This is considerably more of a correction compared to the 15.3% fall in the S&P 500 and only a 9.5% pullback for the S&P value index. This article will take a look at stock market valuations across the globe and the major ETFs that investors could use to help add some global diversification into their portfolios.
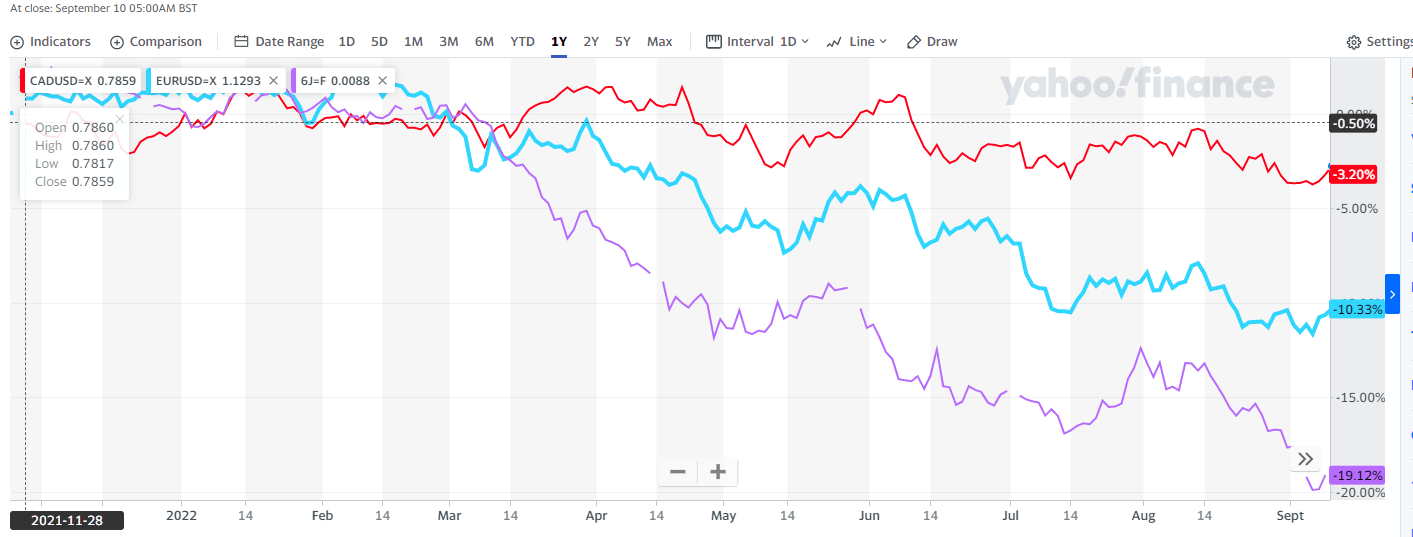
Assisting in the opportunity to diversify globally is the strong U.S. dollar, which makes it an even more appealing time to put US dollars to work in foreign companies. As can be seen in the graph below, the Euro has depreciated by around 10% to the dollar over the past year, with the Yen losing even more ground at around 22%. This means each $1 investment is going further abroad.
Going Global – The Hunt for AAA Companies
There are a plethora of global companies that deserve a spot in your portfolio. Broad market ETFs are a great way to get exposure to global markets and, as usual, Vanguard has some of the most competitively priced passive ETF products. My personal favorites are Vanguard FTSE Europe (VGK) and Vanguard FTSE Pacific (VPL), both of which track the FTSE developed all cap indices for those respective regions. I prefer Vanguard because of the very low management expense ratios of 0.08% compared to a 0.5% MER from similar iShares ETF products.
Numerous foreign blue-chip companies across the globe are also easily investable from U.S. exchanges. From consumer giants such as Nestle (NSRGY) or Unilever (UL) to commodity giants Rio Tinto (RIO) and BHP (BHP), there are dozens of best-in-class global companies to consider for your portfolio. As we dive into the metrics of each ETF, investors can continue to get acquainted with more great foreign companies by looking through the holdings pages of each ETF.
Author’s Application: Readers familiar with some of my writing will know that I utilize a core-satellite approach to portfolio building. This means I complement the diversification of an ETF core with satellite positions in individual stocks I think will outperform the market. Some of the biggest individual foreign stocks in my portfolio right now are: BP and Royal Dutch Shell on the energy front, BASF (think Dow Chemical) and Michelin on the industrials front, and then Unilever and Henkel (think Proctor & Gamble meets 3M) in the consumer defensive sector. Siemens is likely soon to be an addition to my portfolio as well, as the German company is being hit particularly harder than some other European companies due to its unfortunate position being caught in the Russian gas supply dispute.
Intro to European and Pacific Markets
Let’s take a look at the general metrics of European and developed Pacific markets to get a general sense of the comparative valuations and composition of the indices. As mentioned in the intro, the European and Pacific indices are looking a lot less expensive compared to their U.S. counterparts. This can be seen in the graphs below which highlight the lower average P/E ratio of 11.6x for VGK and 11.9x for VPL compared with 20.1x for VOO and 19.1x for the Vanguard S&P 500 Value Index Fund (VOOV). The same pattern can be seen in the lower P/B ratios as well with VPL taking the lead at 1.3x P/B.

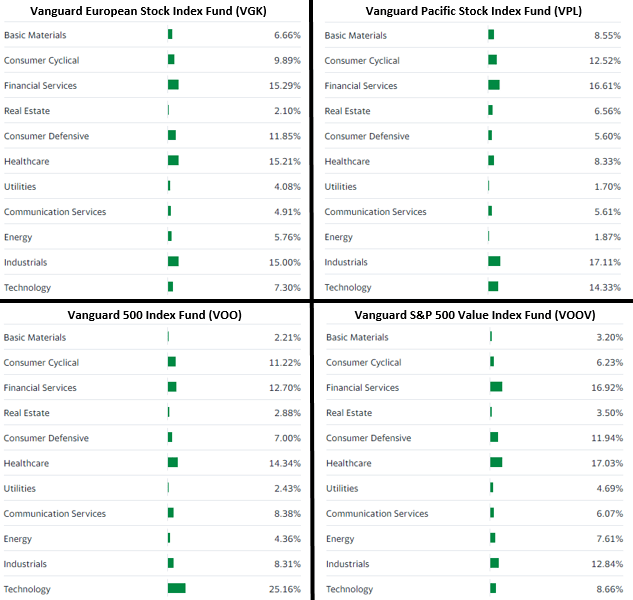
This valuation discrepancy stems mainly from the higher technology weighting of the U.S. indices compared to their global counterparts. For value investors not interested in pricey high-growth tech companies, the global indices offer a lower technology allocation similar to the value index VOOV. The breakdown of each ETF by sector can be seen below where Europe and the Pacific indices have noticeably higher weightings in industrials, consumer defensive, basic materials, and financials. The S&P 500’s 25% weighting to technology far outweighs Europe’s 7.3% weighting and still noticeably is higher than the Pacific’s 14.3% technology weighting. The S&P 500 value index brings this technology weighting down to 8.7%.
Profitability and Growth across Developed Markets
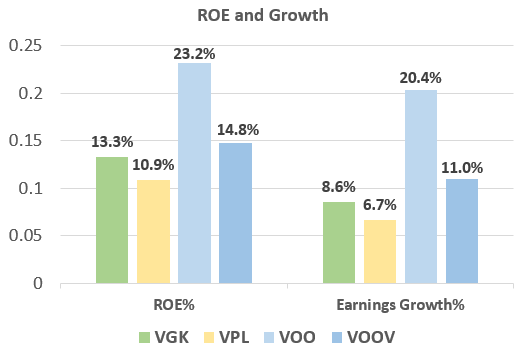
As we further analyze the average metrics underlying each ETF below, we see that the higher valuations in U.S. markets are being supported by higher profitability levels. These differences are, once again, due to the U.S. weighting in the technology sector which carries much higher ROE and requires less capital to grow.
In terms of earnings growth, the U.S. growth rate of 20.4% far outpaces Europe and Pacific markets with 8.6% and 6.7%, respectively. The value S&P index has a growth rate of 11.0%, which is more in line with European markets but still considerably higher. These growth differences are being driven by a few high-growth names in the top 10 holdings of the S&P, including Apple at 5.92%, Microsoft at 5.62%, Amazon at 4.06%, Alphabet (Google) at 3.99%, and Tesla at 1.44%.
We can take a second look at the P/E valuations by calculating the Investor’s Adjusted ROE. By dividing ROE by the P/B valuation, investors see another glimpse of the potential earnings yield they are getting on their capital. As can be seen in the calculations below, this earnings yield is the inverse of the P/E ratio.
European and Pacific markets are offering investors much higher earnings yields of around +8% with the U.S. markets more in the 5-6% range. Through this calculation, we see that the higher ROE figures in U.S. markets support the higher P/B valuations seen in the previous graphs, but the valuation of the U.S. market is still higher overall. Before considering differences in growth, the European and Pacific markets are looking very attractive to value investors in a relative sense.

Takeaway for Investors
European and Pacific markets are looking like a good relative value investment in the current market environment. The European index carries an average P/E ratio of 11.6x and Pacific markets trade at 11.9x compared to 20.1x for the S&P 500 and 19.1x for the S&P 500 value index. For investors who have a portfolio concentrated in U.S. equities, it might be a good time to add some global diversification.
