Update 1/5/2023
“Leaving the question of price aside, the best business to own is one that over an extended period can employ large amounts of incremental capital at very high rates of return.”
Warren Buffett, 1992 Berkshire Hathaway Shareholder Letter
All great businesses generate high returns on capital, and they do so regularly. Companies such as Microsoft, Google, Costco, and Visa all generate high returns on capital, and they remain some of the more long-lasting businesses.
Return on capital drives value because businesses generating higher returns on capital can invest less capital, giving them extra free cash for shareholders’ returns or reinvestment.
As we have learned from valuation discussions, the value of any business reflects the present values of those cash flows.
In today’s post, we will learn:
- What is Return on Total Capital?
- How Do We Calculate Total Return on Capital?
- What is a Good Return on Total Capital Ratio?
- Is Return on Total Capital the Same as Return on Invested Capital?
Okay, let’s dive in and learn more about the return on total capital.
What is Return on Total Capital?
Return on total capital is a profitability ratio that measures investment returns from the company’s capital in debt and shareholders’ Equity.
Like other capital ratios, the return on total capital signifies how effectively a company turns its capital into profits.
A company’s total return on capital helps indicate the strength of the company’s ability to maintain a competitive advantage over competitors. It also helps illustrate how well the company can protect its long-term profits and market share from competitors.
The return on total capital helps inform investors about a possible “moat” surrounding the company’s products and services.
For example, a company generating returns on total capital of 15-20% a year indicates a strong business with a good system for generating profits from the capital.
If a company generates higher returns on total capital, it lets investors know they can expect a decent return on investment if it uses the capital.
Companies that use a lot of capital, such as big-box stores, data centers, and semiconductors, often generate high capital returns if they efficiently turn their capital into profits, such as Costco, Intel, and Amazon.
Measuring earnings with ratios such as return on total capital enables investors to determine capital needs the company must reinvest to continue to grow its value. As long as the company can reinvest at a rate exceeding the cost of generating the capital, it will continue its success.
A great way to consider the relationship between capital and costs is by arranging it as a balance sheet. Using assets and liabilities, we can understand the fixed assets, growth assets, and debt needed to support those assets.
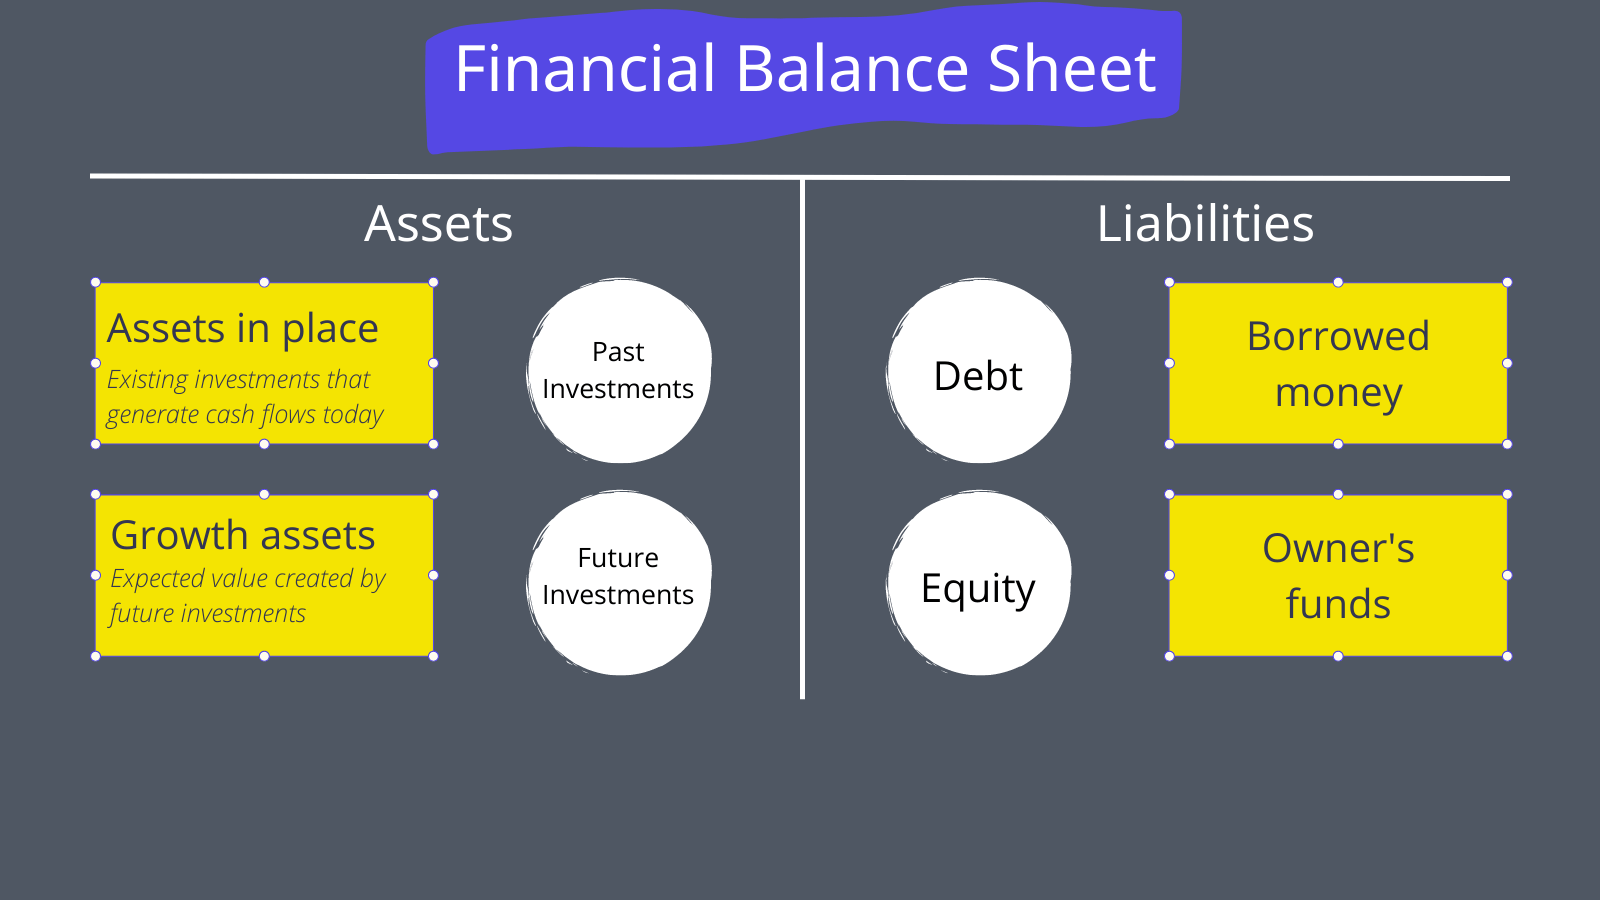
The chart above helps set up a couple of important questions when considering a company’s return on total capital:
- How good are the company’s investments, and do they exceed the funding cost?
- What kind of returns do we expect for future investments?
We can answer by looking at the past, and it requires a little Sherlock Holmes help to determine the answer. We can determine costs of capital and returns from past financial statements.
To answer the second question, we will examine our crystal ball and project based on past results and future projections.
By measuring the changes between past returns, we can make future projections that guide a company’s possible future returns. And then, we compare those returns to the cost of capital.
These calculations help us determine if a company’s investments create or destroy value.
Investments that generate returns over capital costs create value over long periods; for example, Costco delivers outstanding returns over capital reinvestment.
Why focus on measuring past and future investments?
The simple answer is companies generating higher returns on investment than their capital costs earn excess returns and will create higher returns for investors than companies not exceeding their costs.
A company that expects to continue generating positive excess returns on new investments will see its value increase as growth increases. In contrast, a firm that earns returns that match up to its cost of funding will destroy value as it grows.
How Do We Calculate Return on Total Capital?
The return on total capital, similar to ratios such as return on capital employed (ROCE), return on capital (ROC), and return on invested capital (ROIC), measures profitability by comparing earnings to capital.
In the case of return on total capital, we compare operating earnings to total capital.
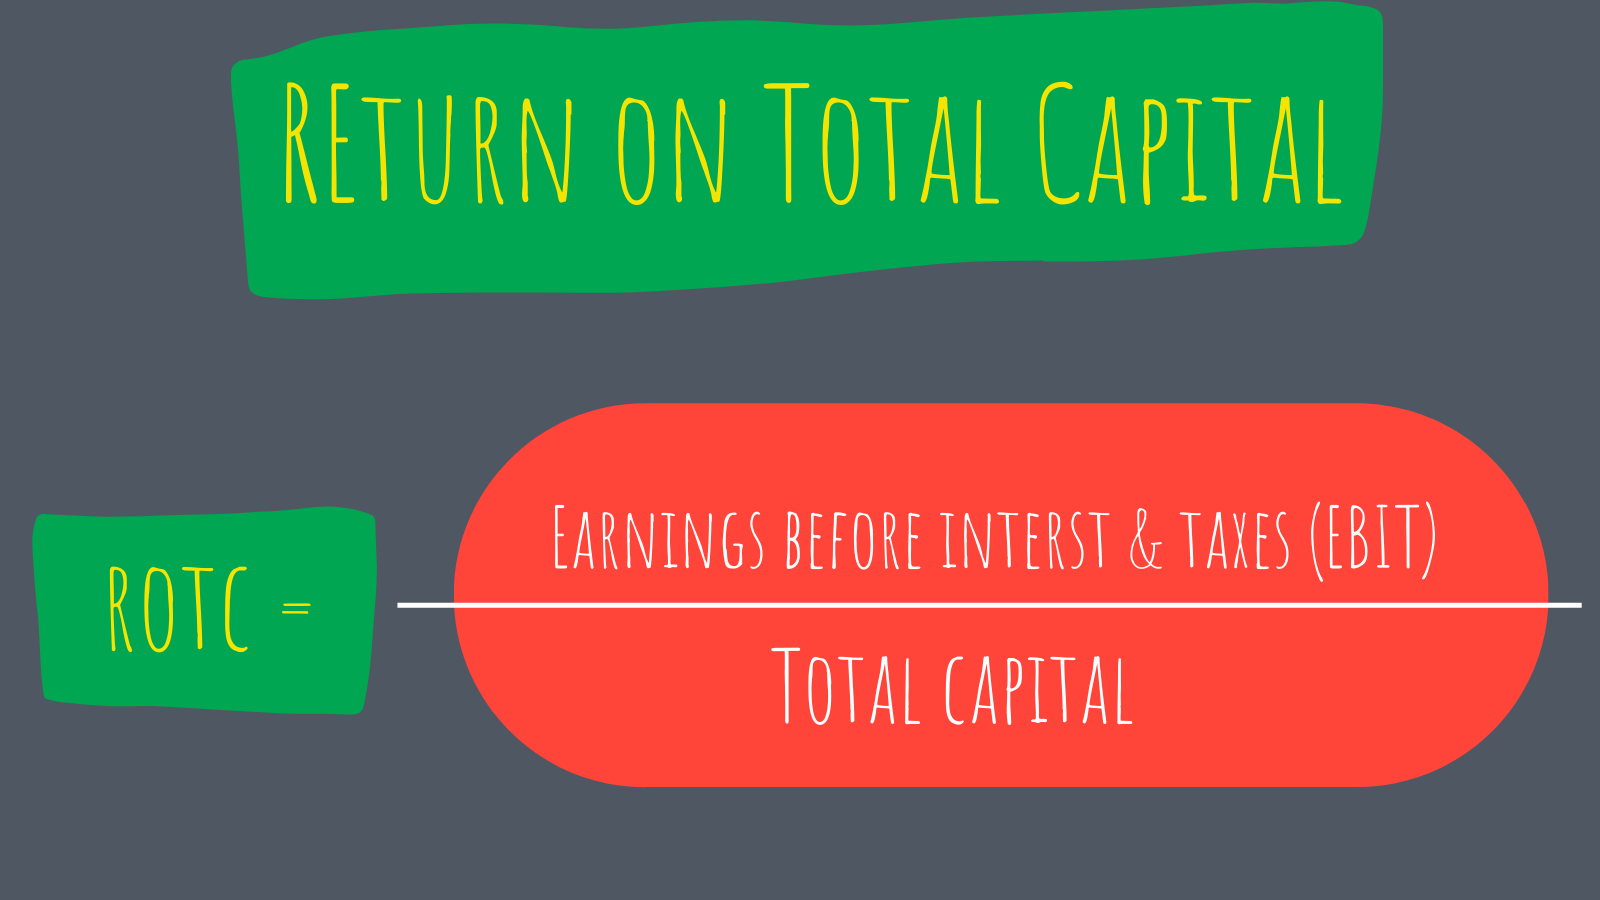
In the formula above, return on total capital expresses profits as a percentage, where:
- Earnings Before Interest and taxes (EBIT) represents profits earned from operations before considering interest or tax payments.
- Total Capital refers to the company’s total available capital for investment. We calculate the capital by adding short-term debt, long-term debt, and shareholders’ equity.
What if a company has zero liabilities outside of short-term debt, long-term debt, and shareholders’ equity?
Then, we calculate the return on assets because the company’s entire capital structure would consist of liabilities, which equals the company’s assets (Assets = Liabilities + Equity).
Return on assets remains a useful profitability metric, particularly for financial companies like banks. However, the return on assets takes a more reactive approach to calculating a company’s use of capital. Return on assets measures business value generated from those assets instead of measuring capital allocation decisions.
Okay, enough theory; let’s dive into putting the ratio to work.
Our first guinea pig is Amazon (AMZN), the retail and cloud giant. You might wonder why Amazon, but the company invests billions in building its data centers to maintain its “moat” around the product and remain competitive.
Along with their investments in the cloud, they spend billions on maintaining their warehouses and expanding those spaces to meet continuing demand.
We need to pull our numbers from the income statement and balance sheet.
**A note on total debt: capital leases now occupy a line item on the balance sheet, and we need to include those balances in our overall debt.**
First, we will look at the income statement to pull the earnings before interest, taxes, or operating income.
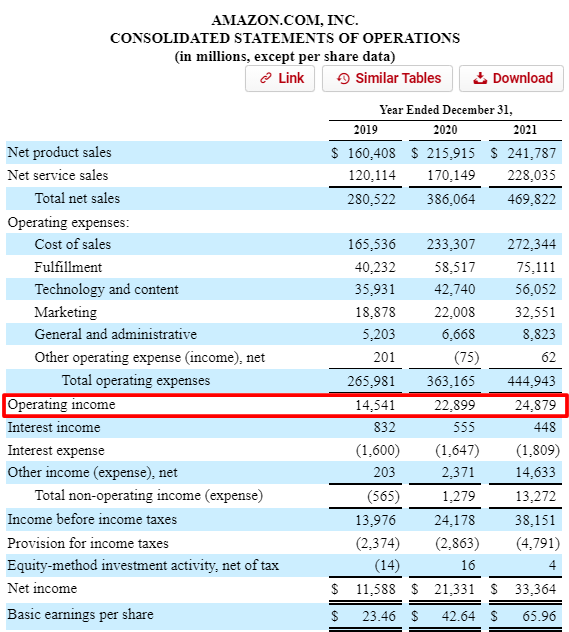
Amazon’s operating income for 2021 was $24,879 million.
Don’t be thrown by the different terminology; some companies will refer to operating income as earnings before interest and taxes, and others won’t. Look for the earnings following all gross costs, including payroll, inventories, and R&D. Anything line item, including interest payments, income, or taxes we want to avoid, too far down the income statement.
Next, we will examine the balance sheet to find Amazon’s total capital.
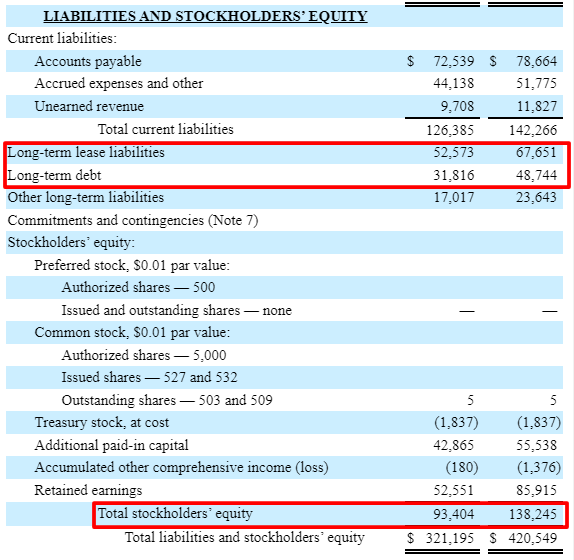
Pulling the numbers from the above-highlighted line items, we see:
- Long-term debt = $48,744 million
- Long-term lease liabilities = $67,651 million
- Total shareholders’ equity = $138,245 million
Now, we can calculate the return on total capital for Amazon:
ROTC = $24,879 / ($48,744 + $67,651 + $138,245) = 10%
Once we get the hang of using this ratio and any other ratio, a good practice is to look at these ratios over longer periods; five years is a good starting point.
Amazon’s return on total capital over the last five years, based on the company’s financials:
- 2020 = 11.6%
- 2019 = 10.4%
- 2018 = 15.9%
- 2017 = 5.6%
- 2016 = 10.4%
Looking at these ratios over a longer snapshot shows how well or poorly a company allocates its capital. We can also see the impacts of large capital decisions in the short term and possible long-term results.
For example, Amazon recently announced increasing capital spending to grow AWS, their cloud segment. Tracking Amazon’s return on total capital helps us determine how successful those investments grow the AWS segment revenues.
Remember, using the return on total capital ratio helps determine profitability and successful investments; the higher, the better.
Let’s take another one, shall we?
For our next guinea pig, let’s use Northrup Gruman (NOC), the defense contracting giant, as an example of a company with assets and liabilities different from Amazon’s.
Here are the income statement and balance sheet with the required inputs highlighted:
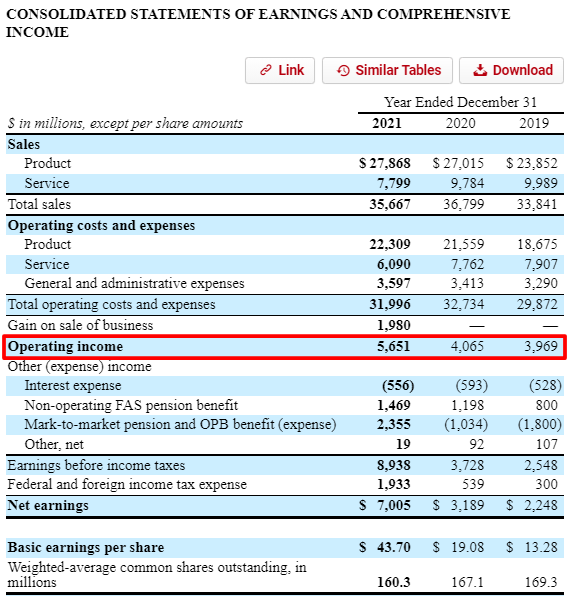
Operating income:
- 2021 = $5,651 million
- 2020 = $4,065 million
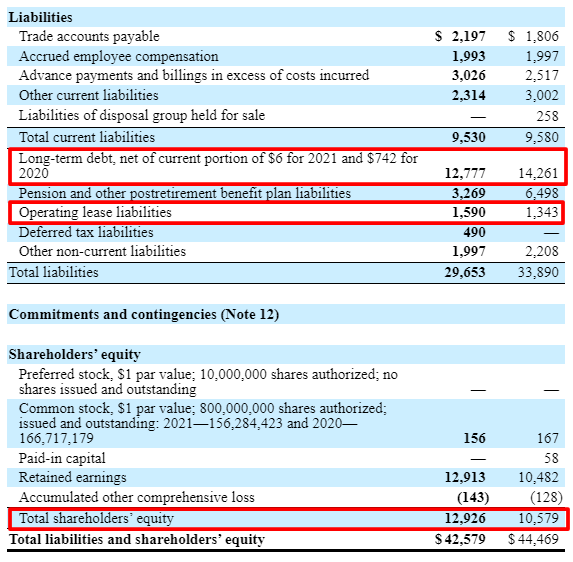
Long-term debt:
- 2021 = $12,777 million
- 2020 = $14,261 million
Leases:
- 2021 = $1,590 million
- 2020 = $1,343 million
Shareholders’ equity:
- 2021 = $12,926 million
- 2020 = $10,579 million
And now, we calculate the ROTC for Northrup Gruman:
2021 ROTC = $5,651 / ( $12,777 + $1,590 + $12,926 ) = 21%
2020 ROTC = $4,065 / ( $14,261 + $1,343 + $10,579 ) = 16%
And looking at the company’s ROTC over the next three years:
- 2019 = 12.2%
- 2018 = 18.4%
- 2017 = 19.9%
Another good practice is to compare the ratios to others in the company’s sector or industry. For example, in the defense sector, we see 2021 ratios:
- Raytheon (RTX) = 6.3%
- Lockheed Martin (LMT) = 32.5%
- Boeing (BA) = (1.5%)
- General Dynamics (GD) = 14.2%
A great way to think of the ratio and how it impacts a company is to put it into dollar terms. For example, Northrup Gruman earns $21 for every $100 of debt and equity compared to Lockheed Martin’s $32.5 per $100.
Comparing them clarifies how much profit a company generates from its capital.
Here is a calculator to help make this process as simple as possible.
Return on Total Capital Calculator
What is a Good Return on Total Capital?
The general answer is that the higher, the better, but the consensus is anything exceeding 5% is good, and any ratio above 20% is outstanding.
But, as with anything related to finance, it depends.
A more important idea than a particular number is comparing the ratio to the costs necessary to generate the ratio.
For example, if a company generates profits of $5 but costs $6 to create those profits, those profits destroy value for investors.
Therefore, it is important to understand the ratio between capital and the cost of capital.
The bigger the gap between the two, the company will enjoy more long-term profitability and better returns for shareholders.
For example, Google, arguably one of the best businesses globally, creates returns on total capital of 27.6%, compared to the costs of 7.65%. This means that for every $27.6 in profit Google earns, it costs them $7.65 to generate those profits.
Below is a chart highlighting the different returns on total capital for various market sectors to compare your company to the overall sector and market. Please use this reference when comparing your company’s performance.
Here is a chart highlighting the returns on total capital for the entire market over the last five years.
We can use the above charts and graphs to help us compare one company to another in their respective sector and the broader market. These comparisons help us determine how well the company positions itself in each sector and market and against competitors.
A company with higher capital returns will attract rivals, but depending on the company’s cost will determine how successful the competition is. Don’t compare banks to software companies because that is not a fair comparison.
We must remember that comparing Wells Fargo to Google is not fair because their capital structures and how they make money differ. These gaps lead to different costs and means of raising capital.
For example, Google generates gobs of free cash flow, which they use to invest instead of debt or equity. In contrast, Wells Fargo uses a combination of deposits (liabilities) and debt to fund any growth.
Is Return on Total Capital the Same as Return on Invested Capital?
Returns on total capital are interchangeable with returns on invested capital, along with returns on capital in the definition.
How we calculate them can differ depending on how you look at the capital part of the ratio.
For example, if you were to calculate the returns on invested capital, you can choose to work from the asset side of the balance sheet and include items such as goodwill, intangible assets, and Net PP&E.
Or you could look at the method of funding the company’s operations via the debt and equity minus any cash on the balance sheet.
When companies reinvest, they use debt or equity to fund those investments, but we choose which side of the balance sheet we choose to look at. For example, using working capital and accounts receivable will give you a sense of the company’s operational efficiency. Using debt and equity gives you a sense of the company’s efficiency in raising capital.
Each method works and gives the same result. But it comes down to which method works for you and how deep you wish to go into the weeds.
Other differences include the difference between returns on invested capital (ROIC) and capital employed (ROCE). The main difference between the two ratios is the type of capital invested.
For example, ROIC divides the net operating profit by the total invested capital, whereas ROCE divides the net operating profit by the capital employed.
But again, the biggest challenge remains to find the difference between the profits and the costs to create those profits or returns on total capital and capital costs. The bigger the gap, the more value the company creates.
Investor Takeaway
The formula and execution of calculating the return on total capital are simple, and understanding the relationship between profitability and the costs to create the profits remains a vital point.
Once you understand the relationship, you will understand the power of companies like Costco, Google, and Amazon.
All three companies generate tremendous returns on their capital, above the costs to create those profits. And that is what makes those businesses not only strong but also long-lasting.
Using ratios like the return on total capital gives you a quick, easy way to find potential companies with a moat, which Buffett mentions is the “holy grail.”
The higher the returns and the longer they can sustain those returns, the stronger the company’s moat.
These can be fantastic investments over long periods.
And with that, we will wrap up our discussion today on the return on total capital.
Thank you for taking the time to read today’s post, and I hope you find something of value. If I can further assist, please don’t hesitate to reach out.
Until next time, take care and be safe out there,
Dave

Dave Ahern
Dave, a self-taught investor, empowers investors to start investing by demystifying the stock market.
