The homebuilding industry is easy to understand as a concept. Companies build new homes, and customers buy and live in them. But there are several moving pieces to consider for this industry, which are key for investors to understand if you are going to buy publicly traded homebuilder stocks.
Homebuilder stocks have been out of favor on a valuation standpoint for over a decade since the real estate meltdown during the Great Financial Crisis.
Heavily cyclical stocks which are dependent on a strong economy tend to trade cheaper in the market as a general rule.
However, there are a few simple benefits to investing in the homebuilding industry which come as a benefit to that sometimes cyclical real estate market, mainly:
- Revenue growth from appreciation in real estate prices
- Real estate has appreciated around 5% annually over the very long term
- The industry is still fragmented and small compared to all real estate
There are a few simple downsides to investing in the companies in the homebuilding industry which include:
- Prices of land tend to follow real estate, raising costs with real estate appreciation
- Costs of labor tend to grow close to 4.5% annually, if measured by disposable income
- Costs of raw materials can really eat into profits especially during inflation
- The cyclicality of real estate make overexpansion by builders costly
- Customers typically wait a long time to buy another home, so builders have to constantly acquire new customers
Let’s dig into all of the major factors which drive the profitability and growth of the homebuilding industry, starting at the macroeconomic level and then moving to the micro side.
Big Picture Revenue Drivers for Homebuilders
As I already alluded to, revenues for homebuilders naturally follow real estate prices, which historically have returned around 5% in the U.S. over many decades.
Another significant revenue driver for the homebuilding industry is household growth, and since the top homebuilding stocks operate solely in the U.S., we will examine U.S. Household growth and its relation to inventory.
First let’s examine this table I created from data from the U.S. Census:

We can see that even over the last 10 years, household formation has come in close to 1% per year even with all of the negative statistics around declining birth rates.
Part of the growth of household formation is probably from immigration, with another significant part problem related to the large Millennial generation aging into household formation age.
Next I want to focus on housing inventory, as supply is a key component to homebuilders’ profits.
In a nutshell, prices and demand for new homes will depend on supply and demand, just like it is for any other product, service, or commodity.
In the case of residential real estate, the more houses that exist the less demand for new homes, in general.
The less homes that exist compared to potential buyers (households), the higher the demand and the higher prices (and volume) that homebuilders can sustain, again in general.
So here’s an interesting statistic(s) that we can again draw from official U.S. Census data which illustrates how this relationship has fluctuated over the years:
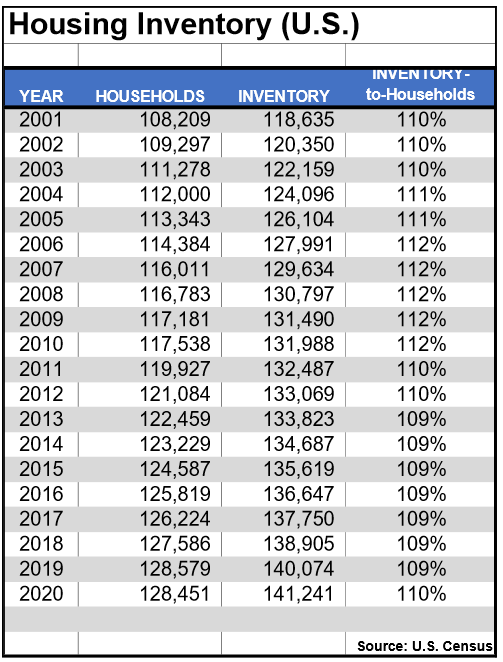
You can see that there’s always been a glut of homes compared to total households, and this becomes even more pronounced when you consider that the average home ownership rate over the same time period has been around 63- 69% of households, according to the U.S. Census Bureau.
But we can also surmise that some households may own two or more homes, and residential real estate can also be held in an entity such as an LLC, so some of all of these things cancel themselves out.
What I find interesting is that the spread between inventory compared to households is pretty slim, and that during the Great Financial Crisis and housing bust inventory was only a few percentage points higher than historical norms.
You can see that from 2013- 2019 the general housing inventory supply was about -3% less than its peak in 2006-2010, but is back to 110% as some homebuilders have ramped up new development activity.
Commonly Watched Homebuilding Industry Metrics
One of the more frequently referenced statistics in relation to housing supply and demand is the Monthly Supply of Homes in the United States, which is published by the HUD (Department of Housing and Urban Development).
Here’s the chart (illustrated by FRED) in all of its wonder:
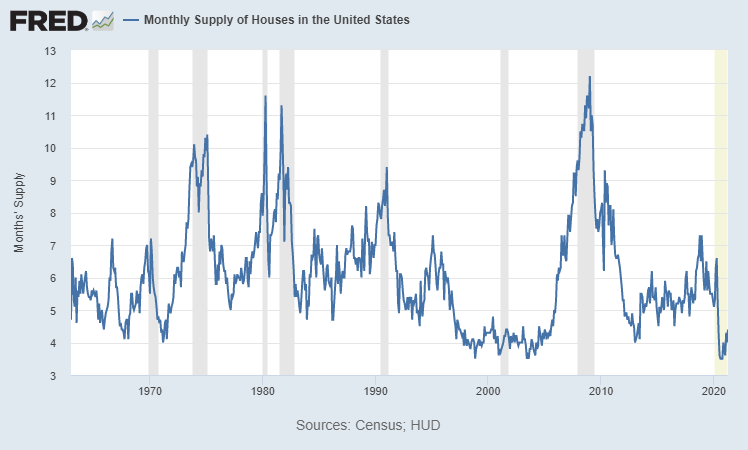
We can again notice a huge surge during the real estate boom and crash of 06’- ’10.
What I want to highlight however is that this statistic can be particularly misleading if you don’t take it in context, especially when investing in homebuilding stocks. If you go on the FRED website where this chart is published, you’ll notice it is defined this way:
“The months’ supply is the ratio of houses for sale to houses sold. This statistic provides an indication of the size of the for-sale inventory in relation to the number of houses currently being sold.”
Notice that we are looking at the supply of houses for sale and those sold. This does NOT reference the total housing inventory supply, but rather the number of homeowners (and homebuilders) looking to sell.
In other words, if we have more people looking to buy rather than sell at any given time this supply of houses statistic will greatly increase, and vice versa.
There are many factors that can cause people to want to sell (or buy), which can have nothing to do with total supply.
Short Term Supply/Demand vs Long Term
For example, the pandemic of 2020 saw a huge influx of buyers to the market, especially compared to the number of homeowners who wanted to stay put.
If we look back at the housing inventory-to-households charts I quoted earlier, this was NOT necessarily an indication of lower total supply.
In fact, housing supply compared to homebuilders actually increased around 1% from 2019 to 2020.
What we saw in 2020 was an outside factor (likely the pandemic) which temporarily tilted the supply and demand dynamic of buyers and sellers, despite an increase in total inventory compared to households.
In the 2006-2010 period, it’s very clear looking back with hindsight that there was both a glut of homes, and a rush of sellers to the market.
On a very big picture, there were many subprime borrowers, some on adjustable rate mortgages, who found themselves struggling to make mortgage payments and trying to get out. On top of that, you had lots of total housing inventory compared to total households.
This imbalance on both the supply and demand side caused homebuilders to take heavy losses in that time period, but you wonder if it was more of a supply problem than demand. More on that later.
Key Factors to the Overall Supply of Homes
One last statistic before we dig into the individual business models of homebuilders.
I found this quite interesting; according to NAHB there are roughly this many homes which are destroyed every year:
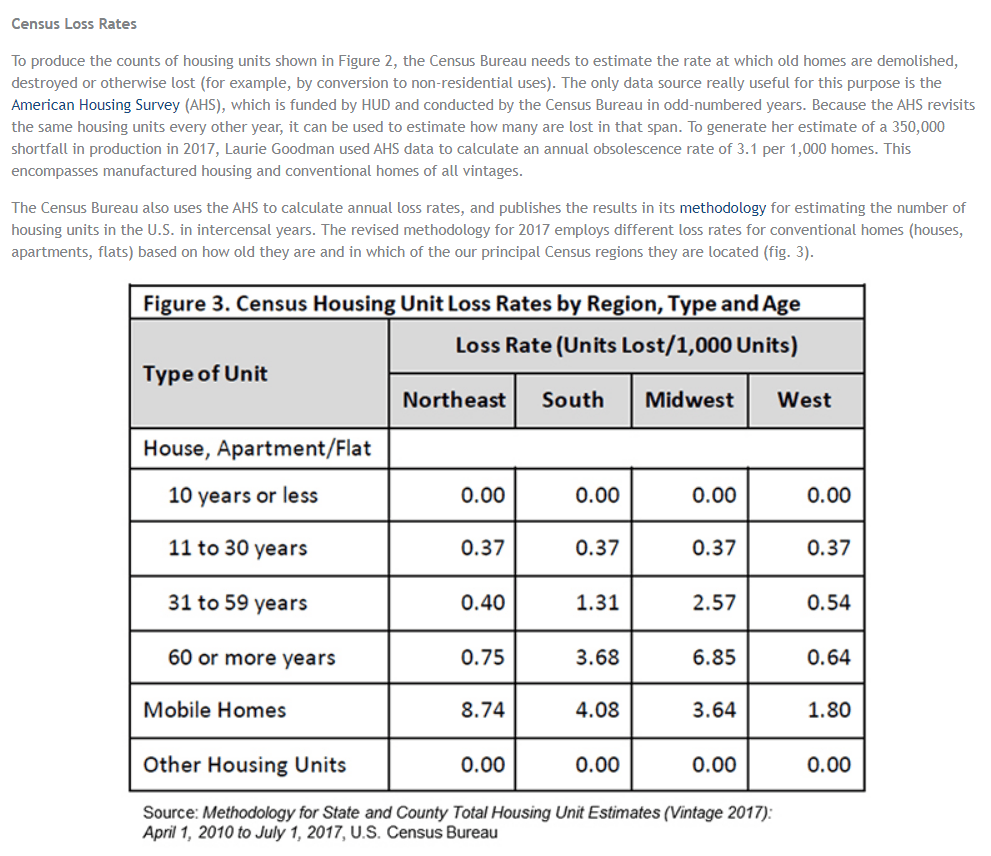
You can see that the loss rate in the table looks at Units Lost/ 1,000 Units. This means that even for houses that were 60 years or older, unit losses were anywhere between -0.6% all the way down to below -0.1%.
This means that once a home is built, it tends to stay in total housing inventory for a very long time.
It then appears that homebuilder companies are in somewhat of a rough spot, as they have to compete not only with each other but also all of the supply that has already been built, some of it by themselves!
This means that unit growth of homes will be mostly limited to the growth in households to the U.S.—which remember we saw has been around 1% annually over the last 10 years.
That said, remember also that most of the revenue growth for these companies is likely to be driven by real estate price appreciation, and so over the very long term a 1% limitation to unit growth might not be the worst thing in the world (as the market matures/ saturates).
The Basics of the Homebuilding Business Model
Now let’s dive more into the nitty gritty of what drives the profit and growth for homebuilder companies.
On a basic level, these companies tend to operate either by:
- Buying land outright, and developing it into new homes
- Buying contracts on land, giving them the option to develop
- Buying options contracts on fully developed land (in the case of NVR Homes)
Most of the publicly traded homebuilder companies today tend to outsource the labor behind constructing the homes to sub-contractors, and themselves focus on the selling and design of the homes and communities which they offer under various brands.
Location, location, location is obviously a key part of operating a successful homebuilding business, as well as maintaining adequate quality control and brand reputation.
While customers of homebuilders might not repeat buy from these companies at the same frequency like they would for other businesses, such as subscriptions or consumables, delivering superior service and satisfaction is still a key part of driving a successful business—as you can be sure word of mouth can go a long way especially in a commission-based sales structure such as this.
Potential future legal liabilities also play a role in forcing the homebuilding industry to focus on quality control, which can be costly but also helps the long term viability of the industry.
Cost Structure and Risks for the Homebuilding Industry
Let’s talk about some of the basic costs for homebuilders:
- Cost to acquire land
- Labor (construction, usually sub-contractors)
- Sales (usually in-house team on commission)
- Commodities such as lumber, steel, and concrete
- Inventory impairments
Over the short term, there’s inflation risk due to the companies’ need for raw materials, but if inflation stays pegged at 2% per year over the long term then it provides opportunities for additional profits growth if real estate continues to appreciate at a 5% CAGR.
Land, labor, and sales will probably generally follow revenues; so there’s a little opportunity for homebuilding companies to experience operating leverage from the materials side but not a substantial amount in aggregate.
Inventory impairments remain one of the biggest risks for homebuilders, which was highlighted in an extraordinary way during the ’06-’10 collapse.
If we were to look at the top homebuilder stocks in the U.S. today, based on market cap, you’ll see that almost every single one took huge impairment losses at some point of the real estate meltdown.
The top five homebuilder companies today, by market cap, are:
- D.R. Horton ($DHI)
- Lennar Corp ($LEN)
- NVR, Inc ($NVR)
- PulteGroup ($PHM)
- Toll Brothers ($TOL)
You can find a list of the top homebuilders in 2006 here, some of which were swallowed by the current contenders.
Going back to their historical financials, here’s an example of some of the biggest inventory impairments taken by the companies, with total net income loss and year occurred included:
- DHI- $2.6B, 2008
- LEN- $1.9B, 2007
- PHM- $2.3B, 2007
- TOL- $756m, 2009
To understand why such huge losses can take place in this industry, we have to understand the inventory itself.
Homebuilders have to take a substantial risk between the time that a contract is signed with a customer to the time the house is delivered.
Where delivery of the home can take anywhere between 2-3 years, in the meantime a customer could (and do) cancel the contract due to an inability to get financing, a job loss, or anything of that nature. Of course, the homebuilders require deposits and things of the sort, but they still risk taking losses on units that are partially developed or not yet started.
The losses happen because as $NVR states in their 10-k, “inventory carrying costs can be significant”.
When demand dries up, homebuilders can be stuck with pretty illiquid inventory which eats away at profits the longer it sits.
For some perspective, both $PHM and $NVR recently reported cancellation rates in the 14-15%.
That’s why you’ll tend to see huge losses during cyclical downturns in the homebuilding industry, and it’s tough to see how that will ever change just due to the nature of the business.
Unless your business model deals primarily with land purchase agreements on already developed units, like NVR does, your average homebuilder will probably continue to see some heavy inventory impairments from time-to-time.
However, I’ll give you two major reasons why these risks might not be as bad as they seem.
Reasons to Be Bullish on the Homebuilding Industry
For starters, most of the top homebuilder stocks today have incredibly healthy balance sheets even when you adjust for this inventory risk.
In fact, all 5 of the top 5 homebuilding stocks have positive working capital even excluding inventory, which means that liquidity shouldn’t be a problem even if large future impairments are needed.
On top of that, many homebuilders are being run very conservatively today and have fantastic balance sheets when it comes to long term debt as well.
Reason #2 to be less concerned with huge impairments…
I’ll steal this quote from Warren Buffett, an investor who also showed interest in the homebuilding industry when his Berkshire Hathaway purchased Clayton Homes in 2003.
“Charlie and I would much rather earn a lumpy 15 percent over time than a smooth 12 percent.”
Take the case of a company like $PHM one more time.
Sure they took the huge losses in 2007 and 2008.
But if we look at their long term Free Cash Flow, the company has earned over $8.2 billion over the past 20 years. Their ROIC is steadily improving, and the future looks bright.
With some business models, you can’t avoid the realities that affect each company’s financials in a similar way.
For most homebuilding companies, that means taking on the risk of overinvestment into inventory and a destruction of shareholder capital. This needs to be considered, and if managed prudently, can lead to outsized gains for buy and hold investors due to the attractiveness of residential real estate.
When you combine the fact that the homebuilding industry is still very fragmented—$PHM managed $11B in sales in 2020 and yet only has 3% of the new home sales market—companies within the space should be able to stick to their profitable niches and continue to compound capital at superior rates.
By combining those long term drivers with prudent capital allocation, the right investment in a good homebuilder could continue to lead to outsized returns for many more years.
Disclaimer: I’m personally long $PHM at an average cost of $37.85 per share and recommended the company to subscribers to The Sather Research eLetter twice in 2020.
