Updated: 5/23/2023
For investors, basic interest rate risk management means that your portfolio should still earn a decent return even if interest rates were to trend in an unexpected direction.
History can show us explicitly how interwoven interest rates and valuations (stock prices) have been; history also tells us that changing interest rates are the norm.
Not only that, but some stocks adapt better to changing rates than others. It can all depend on many factors, but especially on how a stock is priced (whether looking at P/E ratios or Discounted Cash Flow models).
If you look at the history of interest rates, they are always changing, and so there is always an effect on your portfolio from them, whether you are aware of it or not.
This means that good interest rate risk management would cushion a portfolio against changing interest rates.
To address these concerns, we will discuss:
- Interest Rates 101
- The History of Interest Rates and the Stock Market
- How Most DCF Models Respond to Changing Interest Rates
- 3 Simple Tips for Better Managing Interest Rate Risk
Interest rates are arguably the most impactful force to an economy and markets. For both active and passive investors, it’s important to structure a portfolio with this in mind.
Interest Rates 101
Capital drives the economy. It can be used to transact, build, and invest. It can also be borrowed and speculated with. Utilized correctly, capital can create prosperity for all parties involved.
You can find capital being used or held by different types of entities:
- Creditors (lenders)
- Debtors (borrowers)
- Investors
- Companies
Capital can drive economic growth when it is borrowed to start a business or when it is exchanged for an equity stake in a business.
At the end of the day, those equity stakes in real businesses are what the stock market represents.
The stock market is just a place to transact those flows of capital.
Now, interest rates help determine the price of both debts and investments because they represent the return that capital holders demand to compensate for the risk of outlaying that capital.
The higher the interest rate of a debt, the higher the return that capital holders demand to make that loan. Generally, the riskier the loan is, the higher the interest rate is.
But the level of interest rates across the board also plays a big role.
If most interest rates are at 1%, then a 2% loan might be considered “high” due to a greater risk; if most interest rates are close to 5%, then a 6% loan might be considered “high”.
It’s all relative because in a healthy market, borrowers and lenders have multiple options for their transactions, and so they should weigh these as interest rates change.
The level of interest rates across the economy can change depending on macroeconomic conditions—when capital is cheap and plentiful, interest rates can go down, and vice versa.
You also have the role of the Fed in how they influence rates; that’s a whole other topic on its own (read this great post by Dave if you’re curious about that).
In the same way that debts are transacted, so are equity stakes.
And the fewer options investors have to make a decent return, in general, the more expensive stocks will be, and again vice versa.
When interest rates are low, investors have fewer alternatives to make a decent return (if bond yields are low, for example), and so the price they’re willing to pay for stocks might be more, and these are commonly included in valuation models.
The history of stock market prices and interest rates bears that out; let’s look at a few of those charts next.
The History of Interest Rates and the Stock Market
Interest rates are a little hard to pin down due to the leading indicator for rates having changed over the centuries.
In an increasingly global economy, and with the U.S. Dollar as the world reserve currency (since the 1940s), the 10-Year Treasury has long been considered one of the primary interest rates to watch.
Here’s a chart from Carriaghill on Twitter, referencing the excellent book by Homer and Sylla called The History of Interest Rates:
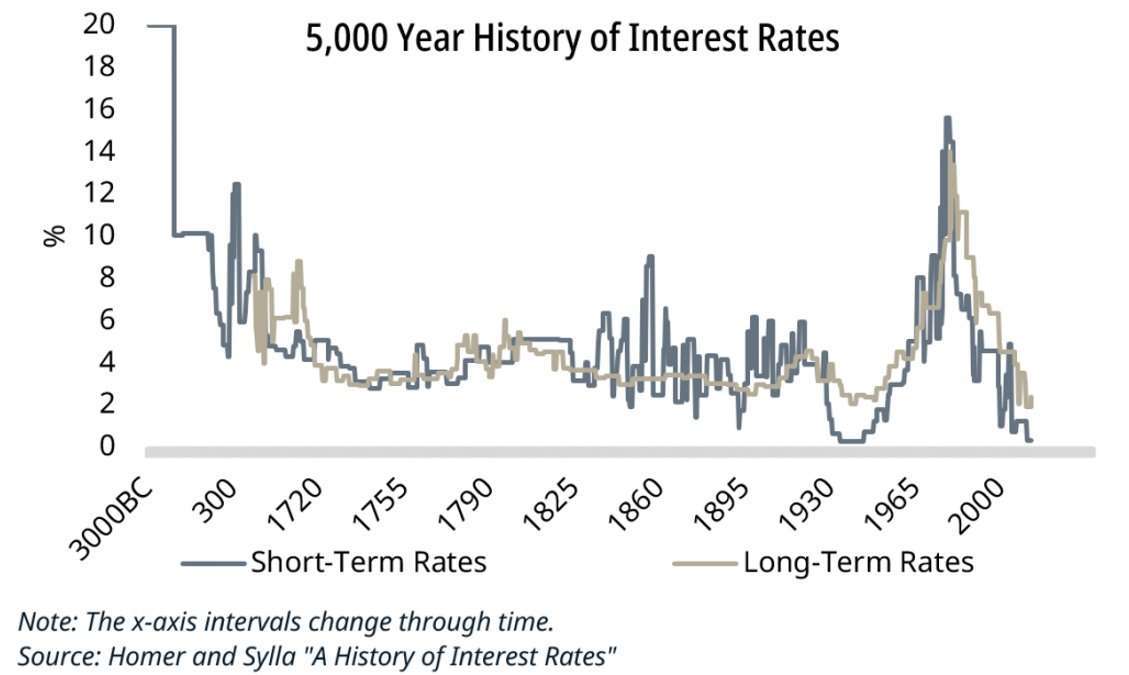
You can see that over the very long term, rates have hovered around 4%-6%. Obviously, the last 80 years have been a different story, with a huge cycle of flat rates, followed by rising rates, followed by falling rates.
It’s hard to tell by this chart but keep in mind that the U.S. had ultra-low interest rates for about a decade+ in the 1930s/1940s period, and then it went on its long uptrend and then downtrend.
Let’s compare more recent rates to the stock market.
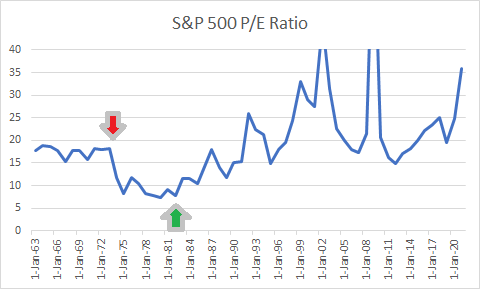
Notice how the P/E for the S&P 500 cratered in the 1972 / 1973 time frame and then it bottomed around 1981- 1984 period.
Here’s how interest rates looked in the same time period:
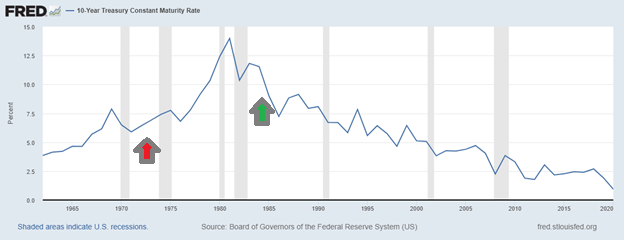
Interesting how the extremely high rates in the 1975-1985 period correlate almost perfectly with ridiculously cheap stocks (P/E’s below 15), and how the stock market P/E continued a steady rise after rates fell to more reasonable (compared to historic) and falling levels.
Much of this likely has to do with the way that the intrinsic value of most stocks are evaluated, using the discounted value of future free cash flows, or the DCF.
How Most DCF Models Respond to Changing Interest Rates
(Warning: For advanced stock pickers)
It’s no secret that the discount rate that you use in your DCF models will play a big role in valuation. This is especially true for growth stocks with little in the way of earnings today.
And since interest rates are one of the primary inputs to a discount rate, they also play a very big role.
Think about it.
Growth stocks today don’t have much free cash flow or even negative free cash flow. It is assumed that they will increase cash flows and that their growth potential makes their terminal value high. The ending valuation becomes more heavily weighted on future value (terminal value) than present value.
Value stocks are the opposite. They will have lower multiples (P/E, P/FCF, etc), which means that the market is less optimistic on their future value, discounting that at a higher rate.
Here’s an example using two companies $CMI and $MSFT.
Say that $MSFT is trading at around a 35 multiple and CMI is around a 20. Based on their relative earnings/FCF today, it appears that the market is discounting CMI at around a 9% discount rate while discounting MSFT at around 6% (assuming similar 10% growth rates, which isn’t unreasonable).
Throwing their financials into our “little package” FCFF DCF spreadsheet, I can calculate that for MSFT at a 6% discount rate, 72% of the Total Present Value of FCFF is from Terminal Value.
For CMI at a 9% discount rate, only 61% of the Total Present Value of FCFF is Terminal Value.
If I were to switch both company’s discount rates, MSFT would revert to 55% from Terminal Value and CMI to 75%. They’d switch camps.
In other words, it’s the Terminal Value which impacts both companies’ valuations the most (at 6-9% discount rates), and the lower the discount rate assumed, the higher this percentage.
This is because:
- Most DCF models (like our FCFF DCF) assume a discount rate (cost of capital) in perpetuity, and cost of capital is low today
- Companies trading at higher multiples to FCF are more reliant on lower discount rates to sustain their higher multiples
This could potentially be a problem if interest rates rise, even to the historical 4%- 6% range, because discount rates would push to around 10%, meaning much lower multiples on present free cash flows.
That could explain why P/E multiples were so high during 2020/2021 (the average for the S&P 500 hit 35!) and yet were much lower in times of higher, or more “normal” interest rates.
3 Simple Tips for Better Managing Interest Rate Risk
You might wonder why all of this matters if you are an investor specifically concerned with holding great businesses for the long term.
If you are trying to do that, I’m 100% in your camp.
Let me just present some basic ideas which make logical sense to me. These ideas are very much a work-in-progess, any may not be a perfect prescription for your portfolio. Use the ideas hopefully as a launching pad to thinking about interest rate risk management in your own investing.
1—Lengthening Your Stock Holding Periods
For one, I’m concerned with buying and holding stocks for 5-year, 10-year, and hopefully 20 or 30+ year time periods.
We have to stay realistic with some of these assumptions, as most companies probably won’t live to 30-40 years (more likely than not they’ll get acquired along the way).
But being an investor who wants to buy great companies at a decent price, and will use fundamental analysis of a company’s financials to determine that, I have to think about how likely it is that the market will recognize growth if I’m correct on which companies are great.
I really like a nugget which I found in The Warren Buffett Portfolio by Robert Hagstrom, I explained it in this blog post:
“From a laboratory group of 1,200 companies over four sets of time periods—five, seven, ten and eighteen years dating between 1978 to 1995—Hagstrom and his team discovered the following correlations between stock prices and earnings performance:
3-year holding periods: correlation = .131 to .360
5-year holding periods: correlation = .374 to .599
10-year holding periods: correlation = .593 to .695
18-year holding period: correlation = .688Where correlation describes what percentage of price variance was explained by earnings variance.“
In other words, only after you get to around 5-10 years of holding a stock, it’s a decent assumption to expect at least 50% of the stock’s price change to be related to the earnings change of the underlying business.
That might be shocking to you—it was to me.
If you’re only holding for 1 or even 3 years, that price movement might be more about noise than anything else. So we have to start with a longer holding period for a DCF model to even have a high probabilistic chance of being successful.
2—Use a “barbell-like” approach when buying stocks
One of the popular strategies which I heard talked about more during 2020 was the idea of having a barbell portfolio, where you equally buy both growth and value stocks.
Since interest rates likely have a major bearing on whether growth stocks (high terminal or future value) or value stocks (high present value) will outperform, having both should shield your portfolio from very poor relative performance regardless of which interest rate environment we see next.
It might also hinder your relative outperformance; if growth stocks outperform, then a growth stock portfolio should beat yours because your value stocks would weigh you down, and vice versa.
But it could also help you find success as you’re mixing and matching “present value” and “future value” stocks, helping you avoid falling victim to an environment of few opportunities, and constantly waiting for that value/growth pendulum to swing back.
I don’t prescribe to the idea that a barbell portfolio should necessarily have a 50-50 balancing, but I think value investors (like myself) should periodically “pay up” to add some wonderful companies at decent prices.
3—Control the things you can control
While I tried to provide a simplified overview of interest rates and the stock market for teaching purposes, the reality of the economy is that it’s so much more complex.
Just like nobody can truly understand every single impact of species and raw matter to an ecosystem, it’s impossible to know exactly what contributed to past economic events and what future events hold from today’s conditions.
History doesn’t repeat, but it does rhyme.
So while we can try to forecast a future based on what we know about the past, we can’t rely on these exclusively to mitigate our risks—and there’s no single investment plan which can take away every single risk, ever.
That’s why we should fret that stuff less and focus on ourselves more.
If you’re picking individual stocks, try to focus on finding the best businesses that you can which have the greatest chances for longevity and continued competitive advantage if your goal is a long-term holding period.
If you’re investing a generalized portfolio, think about applying the tried-and-true principles that have worked for investors for generations, like diversification, patience, and dollar cost averaging.
In a way, dollar cost averaging is in itself a form of interest rate risk management because it forces you to continuously invest capital into a continuously moving interest rate environment, eventually flattening out some of that variation in returns you’d see as interest rates move.
At the end of the day, investing is all about risking capital to make a return.
We can’t eliminate all risk, but we can certainly try to mitigate it. After we’ve made our best effort, the rest is out of our hands.
Find peace in that you’ve made the best decisions that you can with the information you had, and be determined to learn valuable lessons at the times that you end up being wrong.

Andrew Sather
Andrew has always believed that average investors have so much potential to build wealth, through the power of patience, a long-term mindset, and compound interest.
