Post updated: 6/30/2023
Raw materials companies are often-sought stocks during high inflation. Since raw materials companies produce products that are “hard assets”, they are seen as more resilient to inflation.
This can be true at times, but not always.
Pitfalls to buying raw materials stocks as a hedge for inflation is that they can be hard to analyze. It can be harder to know when you are buying low or selling high, because their P/E ratio can often be meaningless.
This is because earnings of very cyclical companies can swing wildly depending on the economy. Many raw materials companies are considered cyclical.
Learning From History
In this post, we will use historical stock prices and stock returns to gain insight into how investors can determine if a cyclical raw materials company is trading at a good valuation or not.
This in-depth deep dive will cover:
- Don’t Buy the Peak!
- Watching Inventory
- Lumber and Homebuilding Value Chain
- P/E and When to Buy
- Watching Capex
- Investor Takeaway
If you are a value investor, these lessons might help you see when it’s better to let your cyclicals ride, and when it’s time to cut your losses.
Lessons from a Raw Materials Distributor
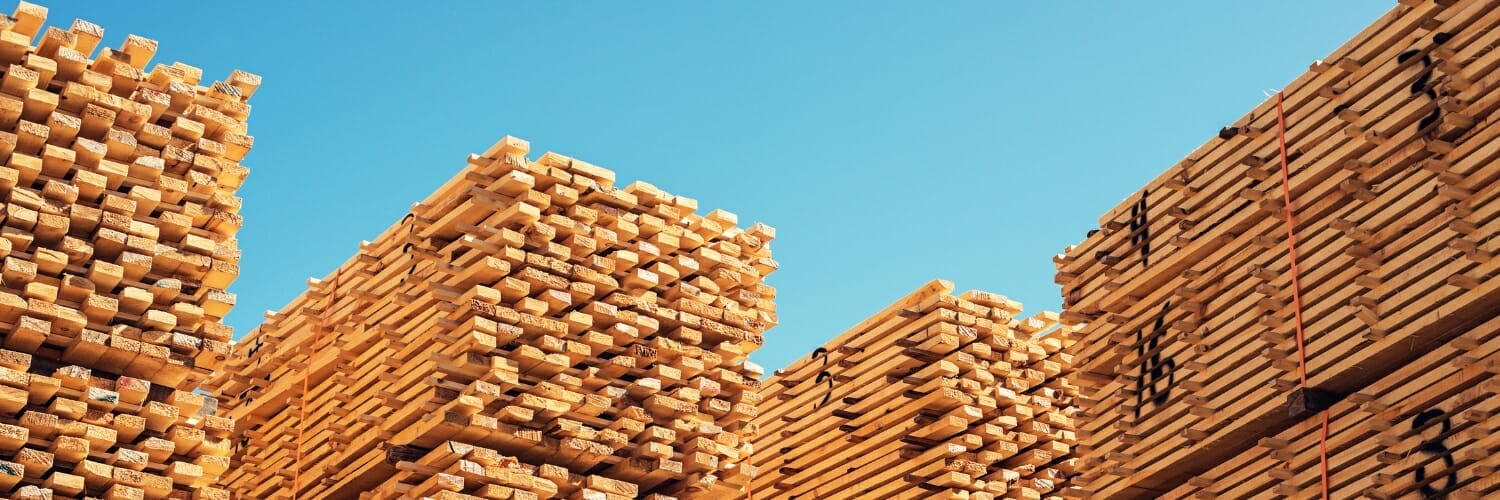
One of the primary raw materials for home building and construction is lumber.
Among the companies in the lumber industry, you have REITs that own the actual lumberyards such as Weyerhaeuser Company ($WY) and PotlatchDeltic ($PCH).
You also have distributors in the middle; one of the biggest lumber distributors is UFP Industries ($UFPI).
A company like $UFPI sees higher profits based on demand and volume rather than directly benefiting from increases in lumber prices. As the company mentions in their 10-k, it can be the movements of lumber prices which create more profits for the company rather than just the overall price level.
What’s important to remember about a raw materials industry like lumber is that there are many different kinds of lumber, with different buildings applications, different supply/demand dynamics, and thus different prices at different times.
The question remains:
- How can an investor best profit from investing in lumber stocks?
- If raw materials companies in lumber make up the literal building blocks of construction, can earnings results of lumber companies foreshadow the future performance of companies like homebuilders?
Luckily for us, $UFPI has a stock history going back to 1993; since then there have been several boom and bust cycles to observe.
Let’s start at the obvious last major drawdown for the company—the housing bust in ‘08/’09.
Here’s a chart that shows the dramatic fall in $UFPI’s stock from the housing crash, courtesy of Yahoo Finance:
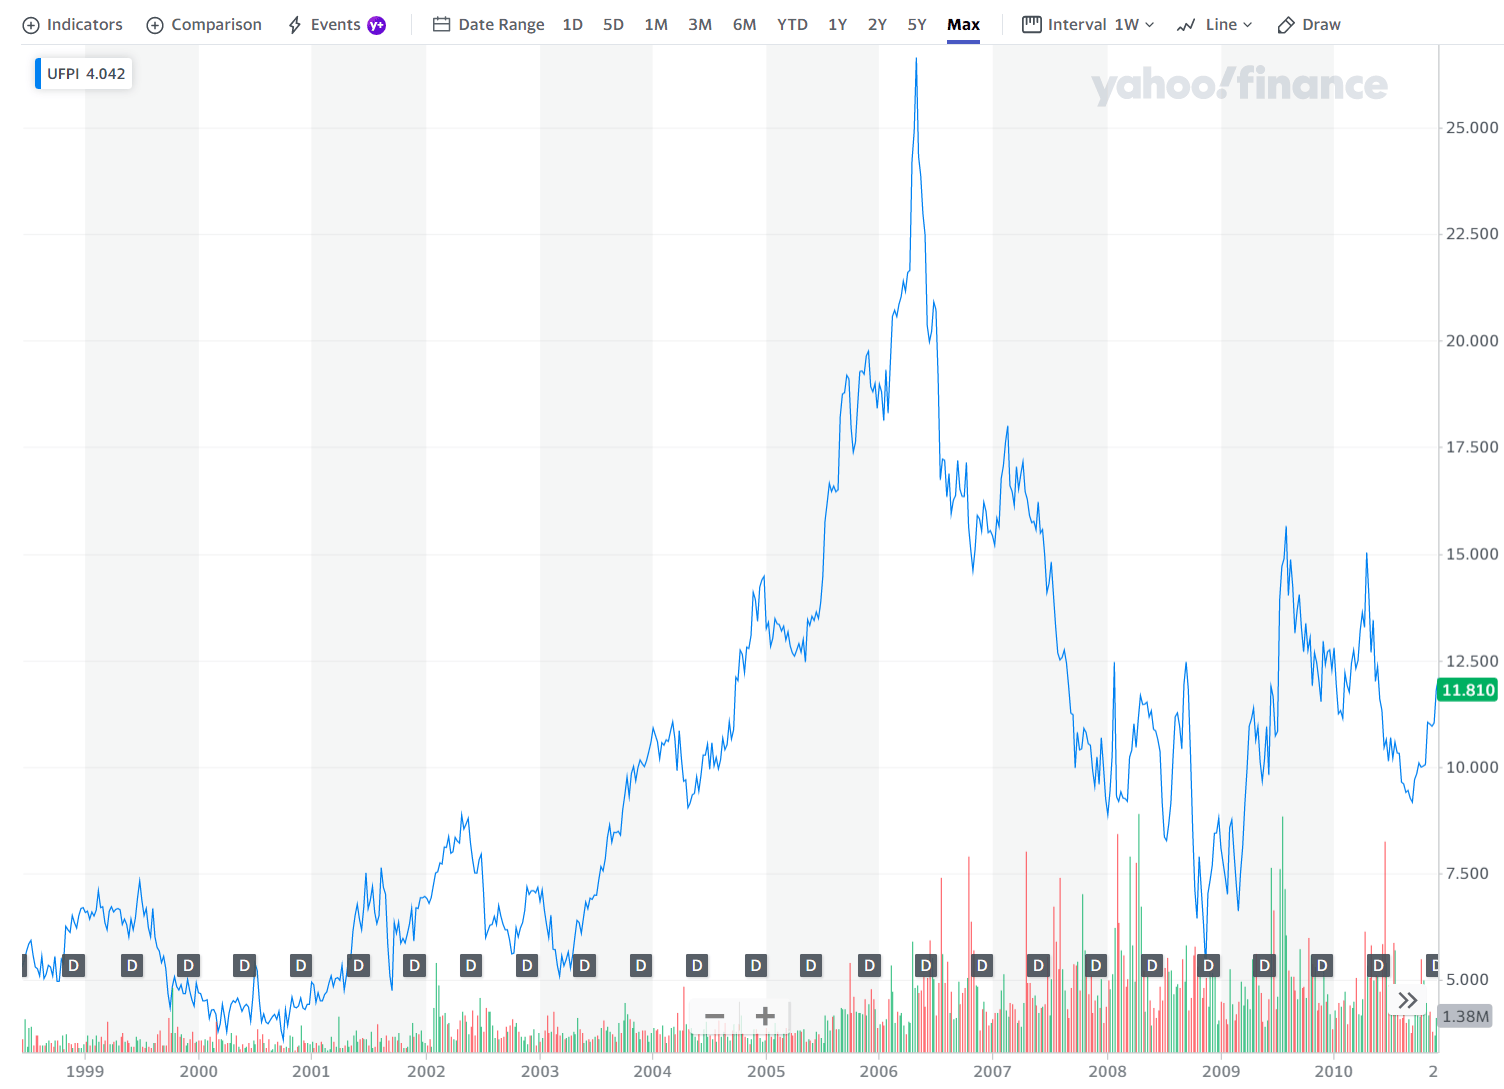
Peak to trough, the stock went from $26.65 all the way down to $5.30. That’s a gut wrenching drop of -80%!!!
Lesson 1: Don’t Buy at the Peak! Reasonable P/E’s are Dangerous!
Obviously, “don’t buy high” is much easier said than done. What makes this idea even more difficult is that a raw materials stock like $UFPI can look very cheap at exactly the worst times to buy it.
To see what I mean, look at this chart from Gurufocus on the company’s historical P/E; I’ll highlight the perilous 2006/2007 period which would’ve been an awful time to invest in the company:
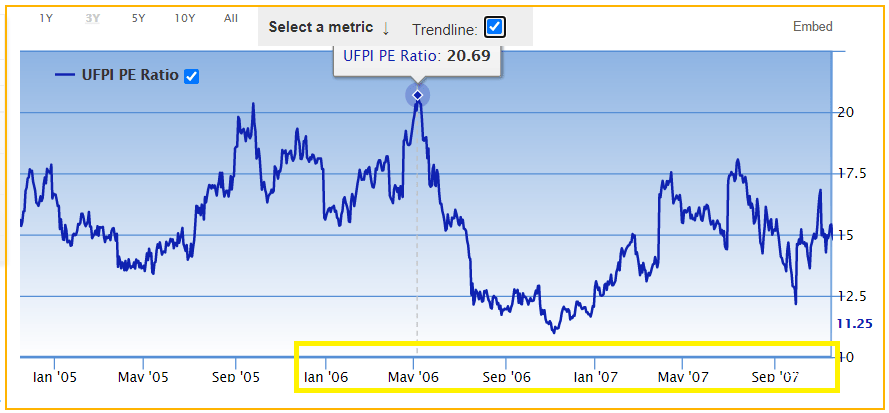
You can see how the peak in P/E corresponds with the peak in the stock price of $26.65. However, notice how much the P/E drops in the September 2006 time period.
At an 11 P/E, the stock appears very cheap, and this is due in part because the reported earnings of the company are still high at the time after the steep drop in stock price.
Even after the first major drawdown, when the stock was around $15-$16 from about July 2006 – June 2007, the returns still appeared substantial if you purchased in 2005 or before.
In other words, most investors probably weren’t too concerned about the stock’s quick peak and drop to $15-$16 because it still represented a nice gain from 2005 and before.
But they weren’t aware that the worst was yet to come, even after the approximate -40% drop from the $26.65 peak.
Was there something in the July 2006—June 2007 which could’ve clued investors in?
To answer that we’ll dive into some of the company’s quarterly 10-q’s at the time.
Lesson 2: Watch the Quarterly Changes in Inventory
Here’s the company’s Income Statement from the May 2006 quarter, which if you’ll recall was the time period where the stock first peaked and then crashed:
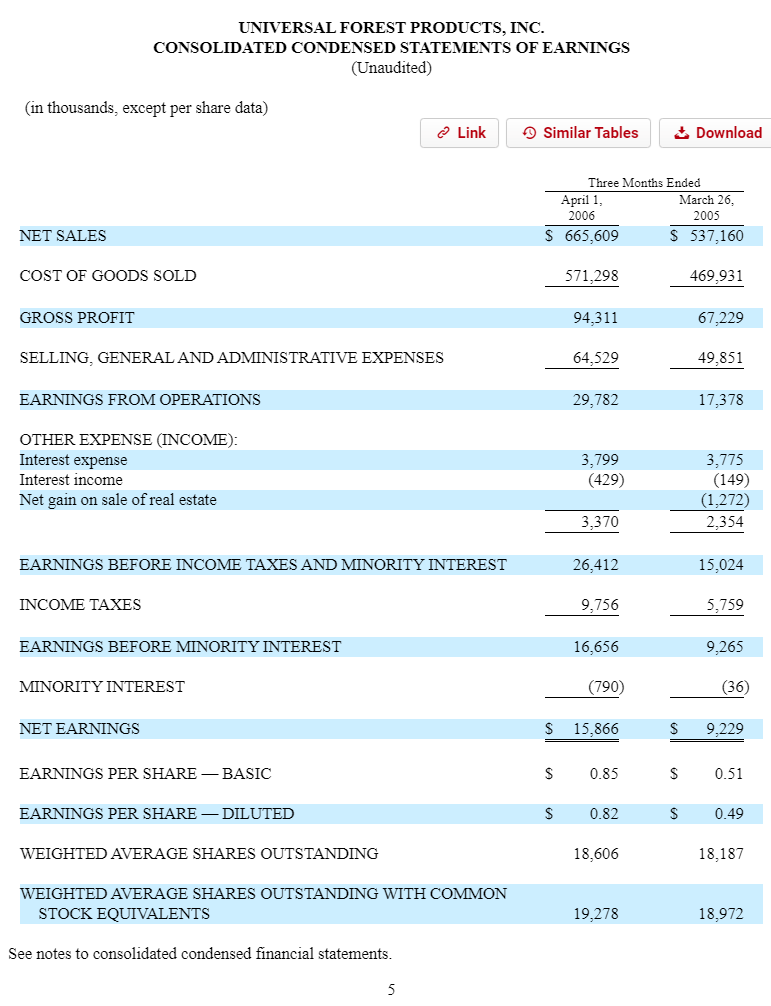
Click to zoomNot much to see here, in fact the earnings are up +71.9% YOY (from $9,229 to $15,866 thousand) and so you might think that the company is humming along and the housing boom still has plenty of room to run.
Looking at the cash flow statement, the only major difference YOY was a -$50 million lower investment in inventories than the previous year. There was probably something in the company’s guidance which drove what happened in the stock price, but let’s stick with the financials and fast forward 3 months.
In the July 2006 10q, it’s a similar story with Net Income with $27.3 million in earnings for a 19.8% YOY increase and 72% increase sequentially (Quarter Over Quarter).
But, cash flow from inventories takes a turn here, with a YTD $7.7 million increase to cash flows from changes in inventories instead of a -$31 million investment YTD the previous year.
This indicates that the company has slowed down investments in inventory, and is selling through more of the inventory rather than adding inventory.
To sum up the year, here’s the company’s changes in inventory by quarter for Fiscal Year 2006:
- Q1 filed 5/11/06: -$25.8 million
- Q2 filed 7/28/06: +$33.6 million
- Q3 filed 10/25/06: +$16.0 million
- Q4 filed 2/27/07: -$1.5 million
Here’s how the company’s changes in inventory has looked historically over the last 20 years:

Click to zoomThere are from company 10-k’s, and so they might be more of a lagging indicator rather than anything else.
To speculate whether the average investor could get ahead of the curve in timing the selling of raw materials companies by observing changes in inventory in the cash flow statement, consider the company’s annual release dates with the Fiscal Years covered:
- FY2006: 2/27/07
- FY2007: 2/26/08
- FY2008: 2/25/09
February 2007 would’ve been a great time to get out of $UFPI’s stock—after any 10-k after that, not so much.
The October 2006 10-q paints a similar picture with regards to the financials—inflows in cash flows from inventories (+$23.6 million) instead of outflows (-$10.7m in YTD 2005).
For Fiscal Year 2007, here’s the company’s changes in inventory by quarter:
- Q1 filed 4/26/07: -$23.3 million
- Q2 filed 8/1/07: -$11.3 million
- Q3 filed 10/25/07: +$34.7 million
- Q4 filed 2/26/08: +$27.7 million
Going back to the stock chart for $UFPI, by this time it’s mostly too late. Though the investments in working capital for Q1- Q2 might’ve seemed like a great sign; it turned out that things were slowing down very soon.
To get some context on the changes in inventory during that Q2/Q3 2006, the Operating Income for the company in Fiscal Year 2005 was $124 million.
So, each increase in cash flows for inventory in the Q2/Q3 2006 period represented 27% and 13% of the previous year’s operating income.
This context on the scale of inventory changes can help provide additional clarity on just how much these quarterly swings really represented for the company.
One fast and easy rule for selling out of a raw materials distributor?
Sell when a significant amount of cash flows relative to Operating Income are now being added from inventory instead of invested into it (preferably after two consecutive quarters).
Lesson 3: The Lumber/ Homebuilding Value Chain Moves Together
Since lumber is a raw material for construction, their stocks tend to be tied with residential real estate stocks.
One example of a residential real estate company is PulteGroup $PHM. Let’s look at their historical stock price around the same time period to observe the similarities:
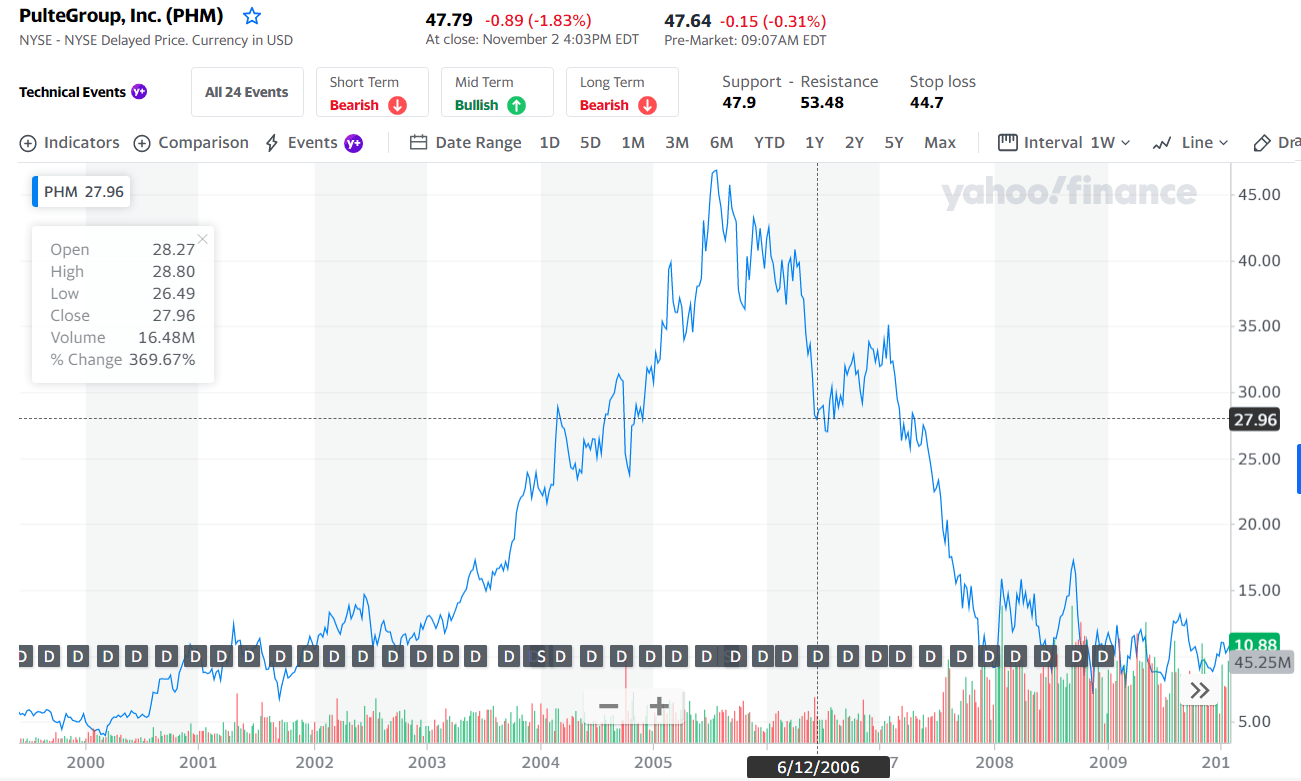
The last peak for $PHM before crashing again was around January 2007. That was a similar time frame for $UFPI’s as well.
In this value chain, where lumber stocks serve as the raw materials companies for homebuilders, it did not seem like the tail is wagging the dog one way or the other.
Looking at $PHM’s inventory investments in a similar fashion to $UFPI’s, it appears that they were still investing even by the time $UFPI stopped—at least when $UFPI stopped in those last two quarters of 2006.
So, looking at a lumber distributor and its changes in inventory might be a better indicator of an impending cyclical slowdown instead of solely watching homebuilder financials.
This logically makes sense since distributors tend to see the demand across the industry faster than its customers and may be able to make better decisions with investments in working capital and their timing.
Lessons from a Raw Materials Manufacturer
The next raw materials stock we will look at today is Westlake Chemical Corporation ($WLK).
Westlake makes for an interesting case study because they produce the plastics and specialty chemicals which make up the building blocks of not only buildings, but also the consumer goods and packaging that makes its way to shelves across the globe.
While this company is also driven by residential real estate to an extent, due to its construction focus especially with its latest building materials acquisition; historically the company has had a large exposure to plastics and polymers markets which will make for a great case study in that poor late 2014- early 2017 time period.
And though the stock had a deep drawdown in ‘08/’09 from a peak of $18.55 to $5.37 (so many stocks were crushed), it also experienced a significant drawdown from August 2014 ($97.24) to June 2016 ($42.48).
Here’s what that time period looked like for $WLK:
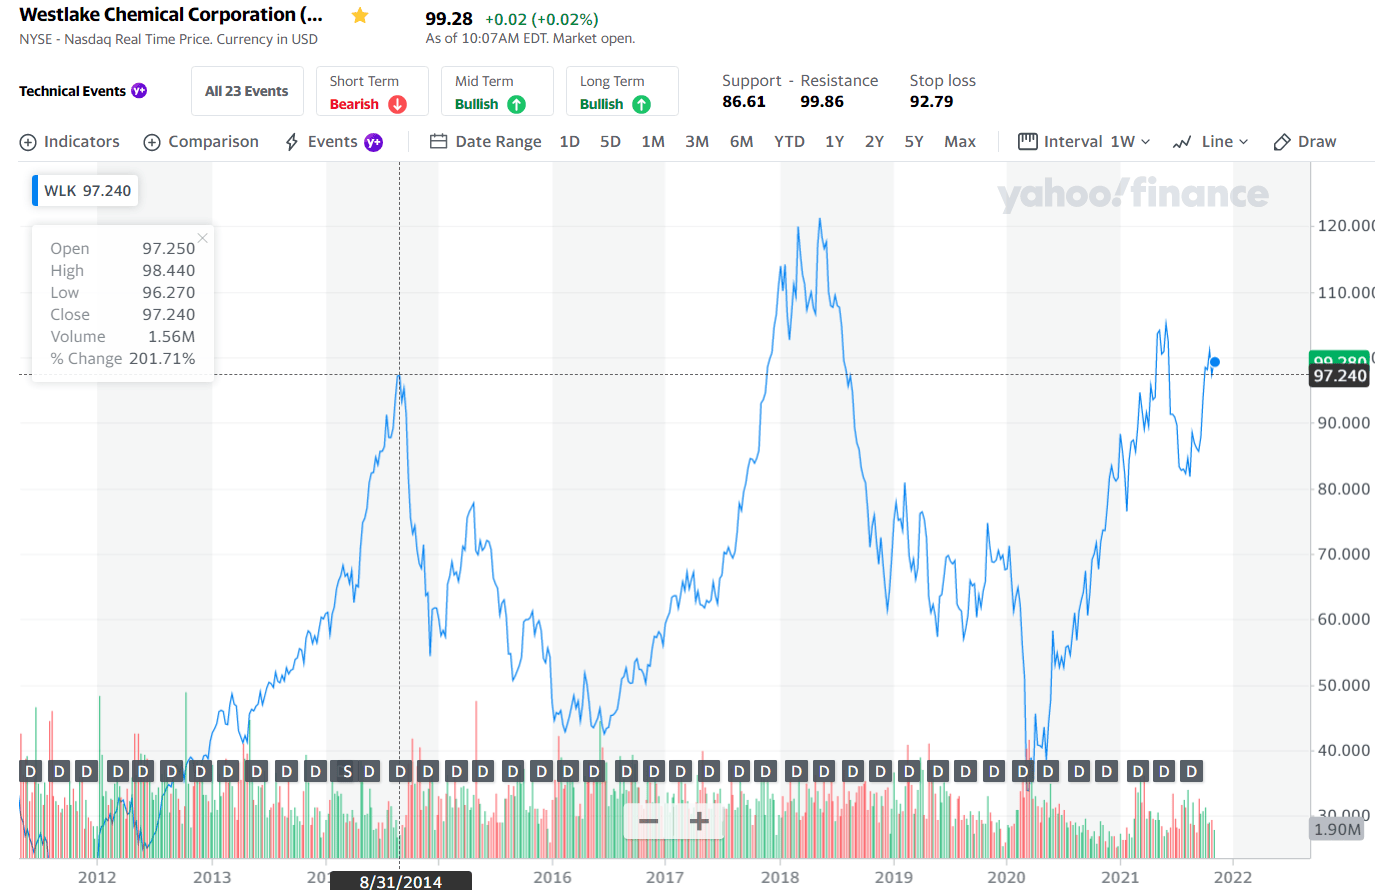
You can see that there was a classic boom/bust cycle starting in late 2014—it’s this historical case study that we’ll use to hopefully apply to other related raw materials companies and those industries with boom/bust cycles which can separate in timing from the typical cyclical.
Lesson 4: The P/E Story Again… “High” is Lower Than You Think
First let’s look at one of those typical “value ratios” for the stock directly leading up to its deep 2015 correction:
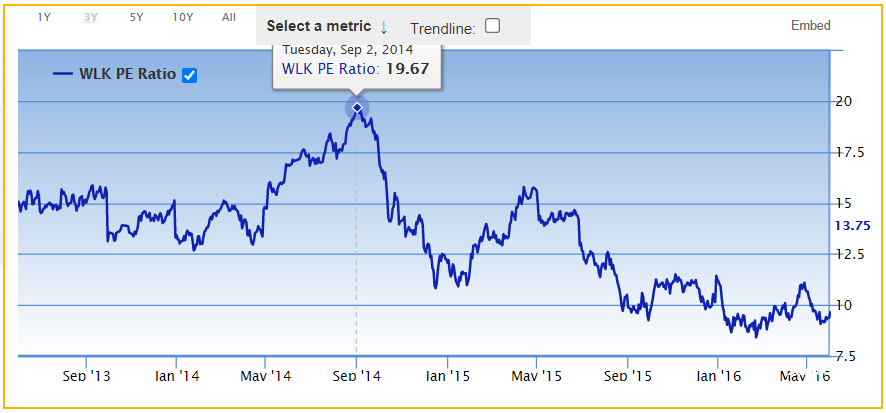
You can see that leading up to the fall in late 2014, the stock’s P/E was trending higher but wasn’t in any way extraordinarily extreme especially compared to the rest of the market.
This has been one of the tricky things about raw materials stocks over the past two decades…
They haven’t traded at crazy high valuations to make a bubble look obvious!
In fact, because raw materials companies tend to be so cyclical and have such wide swings in profitability, it’s at the times when profits are the greatest when it can be the exact worst time to be buying these stocks!
That overly high profitability in boom times is what keeps the P/E lower, but when the bottom falls out it happens quickly and is basically impossible to predict from a standard Price-based ratio.
(Contrast that to technology stocks, which can be so obviously overvalued when their P/E’s are above 100).
Now we’ll go back to the quarterly financials for the company leading up to the stock crash to try and suss out any hints of impending contractions.
Reminder of important dates in this timeframe:
- 8/31/14: stock price peak
- 11/16/14: 2nd peak at $71.40
- 4/19/15: 3nd peak at $77.71
From the company’s 10-q filed 8/6/14, we can see that the Income Statement again doesn’t tell us much about the likely future of the business.
Everything is trending up:
- Revenue = +6.3% YOY
- Net Income = +16.2% YOY
But if we look at the cash flow statement, it’s a very different story:
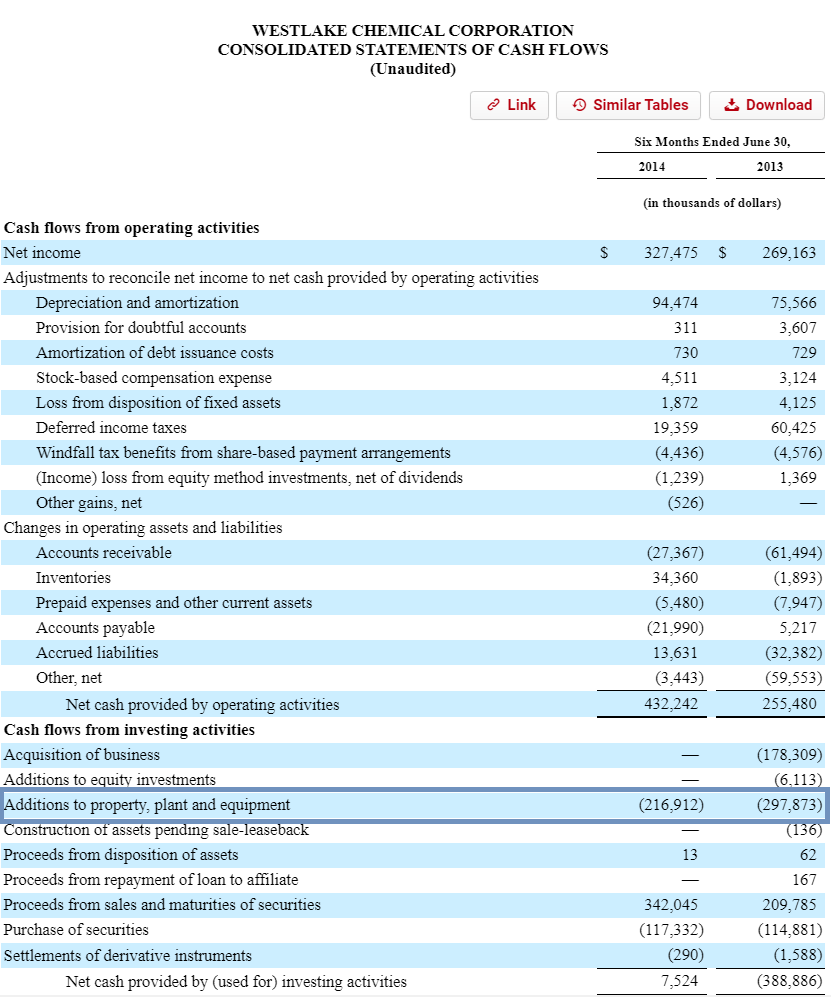
Notice how the cash flow statement shows a much different kind of business than a distributor like $UFPI.
Instead of investments in working capital making up a significant portion of either Cash From Operations or Operating Income from quarter-to-quarter, it is capital expenditures which make up a large portion (50% or more).
Lesson 5: Watch the Quarterly Changes in Capital Expenditures
In this case we do see cash from inventories up +$34.4 million YTD versus investments of -$1.9 million in the previous YTD, but notice the slowdown in capex (capital expenditures):
- Q2 ’14 YTD: Additions to property, plant and equipment of $216.9 million
- Q2 ’13 YTD: Additions to property, plant and equipment of $297.9 million
That might not seem like a significant slowdown, but that’s a full -$81 million reduction in spend from year-to-year, and around a -25% reduction.
You could maybe argue that this has to do with quarterly timing more than anything, so let’s look at a long term picture of the company’s capital expenditures over various cycles.

Click to zoomI’ve highlighted places where the company reduced capital expenditures rather than increased or maintained them. To sum up, those include the Fiscal Years:
- 2009. 10-k filed 2/24/10
- 2010. 10-k filed 2/24/11
- 2014. 10-k filed 2/25/15
- 2017. 10-k filed 2/21/18
- 2020. 10-k filed 2/24/21
The question is—are these good times to sell a heavy capex raw materials company like $WLK or is it more of a trailing indicator?
Well, the answer is kind of both.
You can follow along on Yahoo Finance if you wish, but in general here’s the places where it would’ve been a good time to sell based on the ups and downs of this stock:
- 10-k filed 2/24/10: Too late. Drawdown of -45%+ already experienced.
- 10-k filed 2/24/11: A good time to sell to avoid late 2011 drawdown (-30%), but good time to buy long term.
- 10-k filed 2/25/15: Yes. Drawdown of -30% already happened, but the despair of late 2015-2017 (additional -35% drawdown) could’ve been avoided.
- 10-k filed 2/21/18: almost perfect time to sell. -50% drawdown in 2019 incoming (with more to follow from COVID)
- 10-k filed 2/24/21: We will see.
Going back to FY 2014, in Q1 the company also showed a strong reduction in capex YOY, from -$150 million in Q1’13 to -$110 million in Q1’14.
Taking it both on a percentage basis, -25% reduction, and absolute basis, -$40 million compared to Operating Income of $191 million in Q1’13 (=21% of Operating Income).
Conclusions: Capex, Inventories, and Your Investments
It seems like management for $WLK has historically seen the writing on the wall when it comes to the overall economic trend in their industry and reduced capex before significant downturns in the stock.
What I find striking though is how fast the decline comes.
It took just one YOY decrease in capex from $WLK to precipitate a steep drawdown in the stock.
Investors in heavily capital intensive raw materials companies with large capex investments would be wise to respect how quickly the tide can turn with these stocks. And, just because $WLK’s management has historically been able to stay ahead of these trends doesn’t guarantee that your raw materials company will.
But it’s an interesting observation and another great lesson when following these heavily cyclical companies.
Hopefully this post has helped you identify two excellent forward-looking signals for the outcome of a cyclical industry like raw materials.
Each business model is different, and so it takes some context to understand them (working capital intensive for distributors, capital expenditure intensive for producers). And just because a company is cyclical, doesn’t mean they will manage their inventory or capex well (like many homebuilders in ‘08/’09).
But takeaways like this could help you stay ahead of the curve. And hopefully make you a better investor.

Andrew Sather
Andrew has always believed that average investors have so much potential to build wealth, through the power of patience, a long-term mindset, and compound interest.
