Publicly available financial data collected by investment newsletter provider Sather Research, LLC showed that five Publicly Traded Home Builders by Market Cap grew Total Revenues on average Over 3.85% Q/Q in the July to September quarter, according to Latest Earnings Releases.
Of the top publicly traded home builders who released autumn 2023 earnings results, the following five companies grew revenues 3.85% Q/Q on average: D.R. Horton, Lennar Corp, PulteGroup, Toll Brothers, and NVR, Inc.
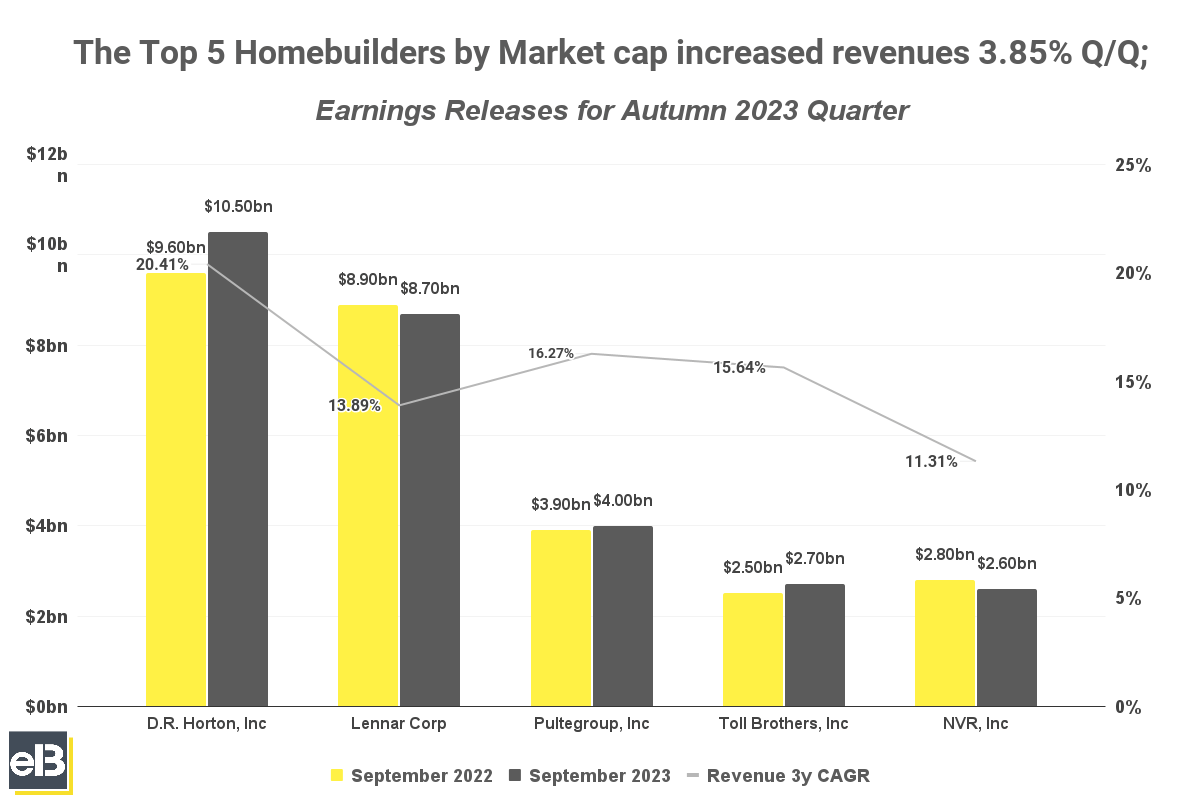
D.R. Horton stood out with the highest growth rate for Autumn 2023 revenues at 9.0%, followed by Toll Brothers at 8.0%.
The following sections are covered in this report [Click to Skip Ahead]:
- Biggest Publicly Traded Homebuilders by Market Share
- Top Homebuilders By Revenue Growth
- Top Homebuilders By Earnings (EPS) Growth
Company revenues, earnings, and stock forecasts covered:
- D.R. Horton (DHI) Stock Forecast
- Lennar Corp (LEN) Stock Forecast
- NVR, Inc. (NVR) Stock Forecast
- PulteGroup, Inc (PHM) Stock Forecast
- Toll Brothers, Inc. (TOL) Stock Forecast
The list below only includes the top five Homebuilders by revenues. In the next section, all relevant publicly traded Homebuilders with >$3B in revenues are included.
| Company | September 2022 | September 2023 | YOY |
| D.R. Horton, Inc. | $9,639 | $10,504 | 5.92% |
| Lennar Corp | $8,934 | $8,729 | 4.73% |
| Pultegroup, Inc. | $3,895 | $4,003 | 11.71% |
| NVR, Inc. | $2,790 | $2,614 | -1.29% |
| Toll Brothers | $2,494 | $2,687 | 11.27% |
D.R. Horton reported a 39% increase Q/Q in net sales orders to 18,939 homes in September 2023 with a cancellation rate of 21% compared to 32% in the prior quarter. However, homebuilding revenue for the quarter decreased -6% to $8.8 billion compared to $9.4 billion of the same quarter in 2022.
Lennar Corp saw revenues from home sales decline by -2% Q/Q which was primarily due to a -9% decrease in the average sales price of home deliveries. Meanwhile, it closed an increase of 8% in home deliveries or 18,559 homes closed.
PulteGroup recorded a 3% increase in home sales revenues which were primarily driven by a 2% increase in the average sales price of homes closed to $549,000. Homes closed increase by less than 1% to 7,076 homes with net new orders increasing 43% over the prior quarter.
NVR, Inc. reported an -8% decrease in homebuilding revenue compared to the previous same quarter. However, net sales orders increased by 7% Q/Q to 4,746 homes with a cancellation rate of 14%.
Toll Brothers increased their U.S. homes sold by 5% Q/Q to 2,524 units with home sales revenue up by 19% Q/Q. However, their homes in backlog were 7,295, down by -32%
Key Takeaway
Despite continued higher mortgage rates and inflationary pressures, most homebuilders continue to enjoy sustained earnings as the demographics supporting housing demand remain favorable with supply still in short. However, data shows that growth is beginning to slow down and remain flat, suggesting the increasing average sales price is muting demand.
Biggest Publicly Traded Homebuilders by Market Share
The donut graph below shows homebuilders with meaningful >$3B TTM revenues as of latest quarter of September 2023.
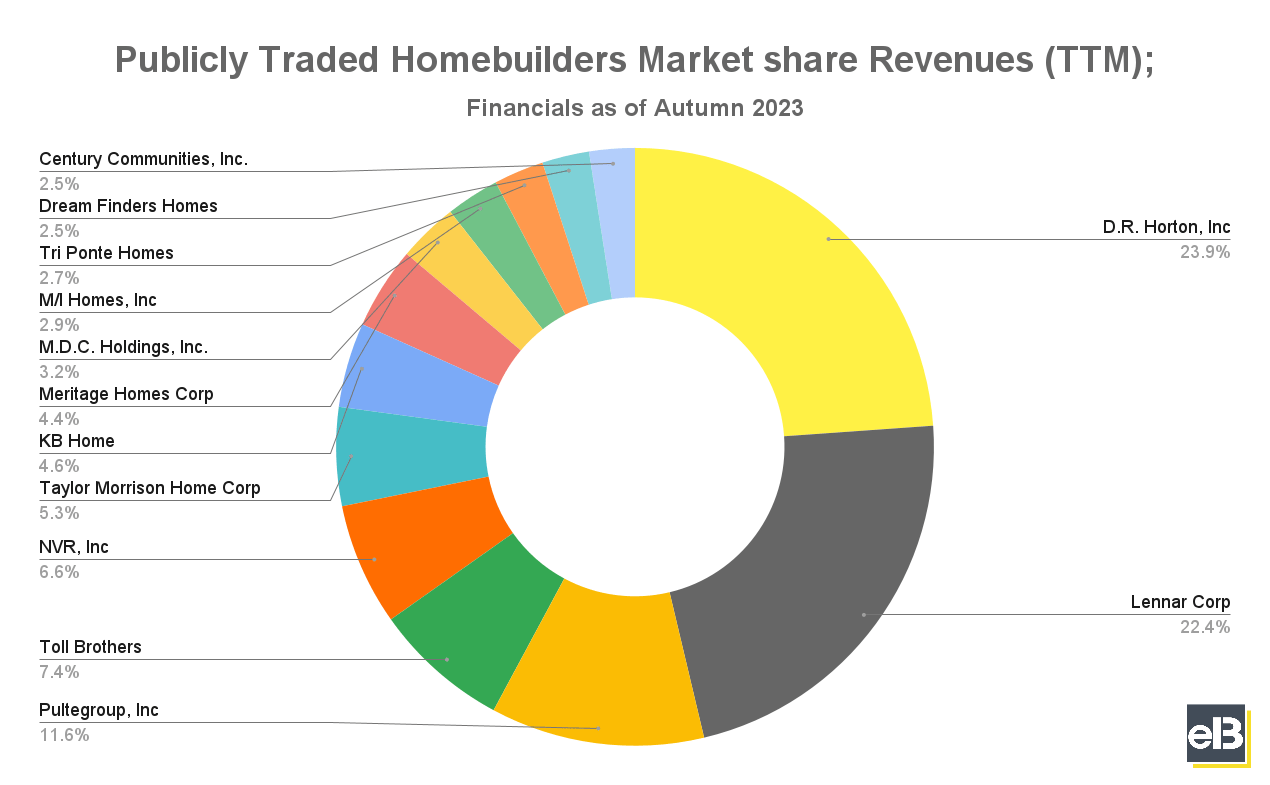
Leading the group is D.R. Horton, Inc. with roughly 23.9% market share, followed shortly by Lennar Corp with 22.4%, and trailing behind is Pultegroup, Inc. with 11.6% of Trailing Twelve Months (TTM) revenue share of all publicly traded homebuilders.
| Company | Revenues (TTM in Thousands | Mkt Share |
| D.R. Horton | $34,698,500 | 23.9% |
| Lennar Corp | $32,536,649 | 22.4% |
| PulteGroup, Inc. | $16,773,624 | 11.6% |
| Toll Brothers | $10,686,924 | 7.4% |
| NVR, Inc. | $9,595,547 | 6.6% |
| Taylor Morrison Home Corp | $7,735,912 | 5.3% |
| KB Home | $6,648,596 | 4.6% |
| Meritage Homes Corp | $6,451,199 | 4.4% |
| M.D.C. Holdings, Inc. | $4,697,815 | 3.2% |
| M/I Homes, Inc. | $4,181,165 | 2.9% |
| Dream Finders Homes | $3,700,769 | 2.5% |
| Century Communities, Inc. | $3,578,910 | 2.5% |
Top Homebuilders by Revenue Growth
In the previous three fiscal years, D.R. Horton Inc. lead among its peers in the homebuilding industry with a 20.41% compounded annual growth rate.
On the other hand, Pultegroup, Inc. and Meritage Homes Corp both tied in greatly boosting their revenues in their latest Year-Over-Year quarterly comparison, growing revenue 11.71% from 2022 to 2023.
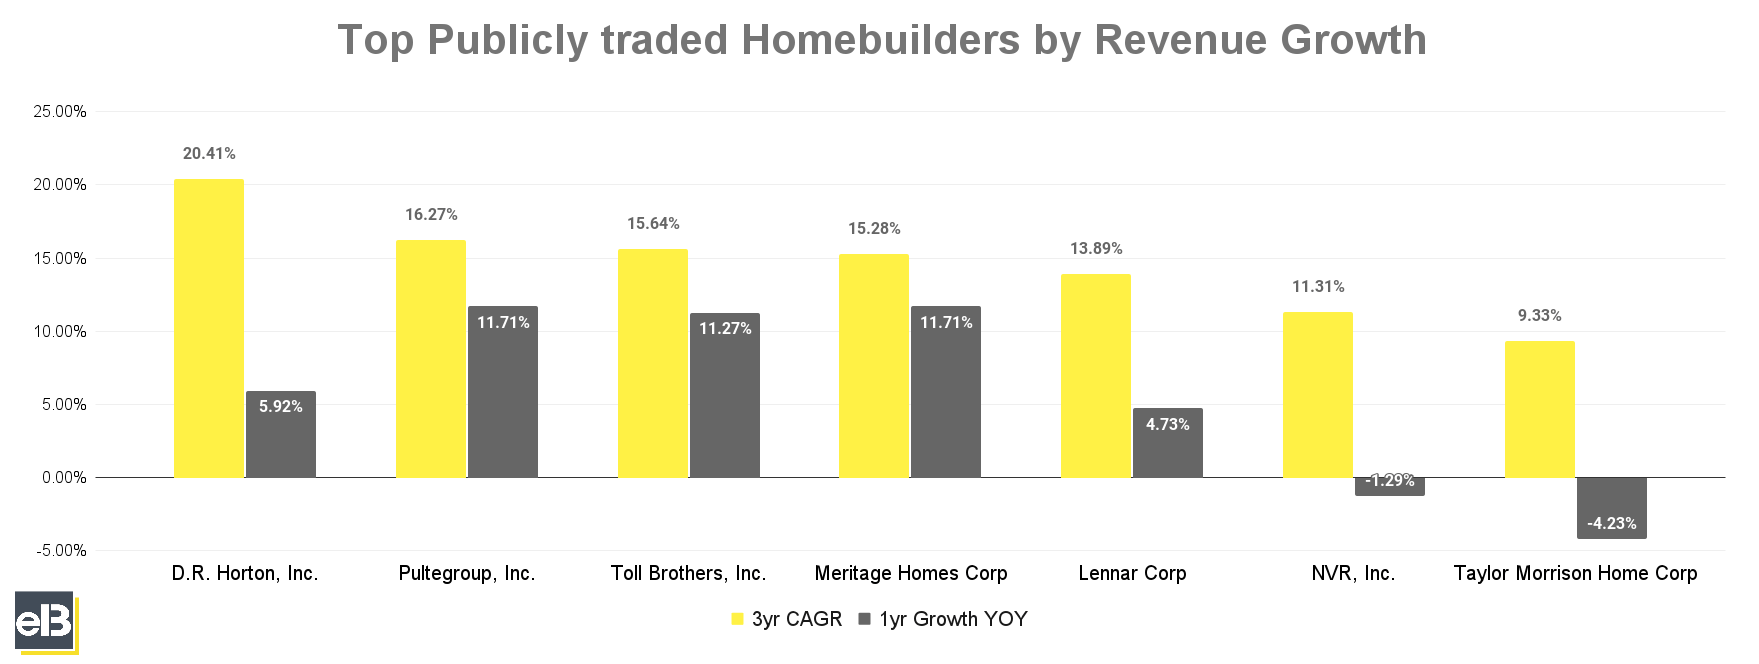
Pultegroup, Inc. takes the number two spot in 3yr CAGR with 16.27%, while trailing just behind is Toll Brothers and Meritage Homes Corp with 15.64% and 15.28% 3yr CAGR, respectively.
| Company | 3yr CAGR | 1yr Growth YOY |
| D.R. Horton, Inc. | 20.41% | 5.92% |
| PulteGroup, Inc. | 16.27% | 11.71% |
| Toll Brothers, Inc. | 15.64% | 11.27% |
| Meritage Homes Corp | 15.28% | 11.71% |
| Lennar Corp | 13.89% | 4.73% |
| NVR, Inc. | 11.31% | -1.29% |
| Taylor Morrison Home Corp | 9.33% | -4.23% |
Top Homebuilders By Earnings (EPS) Growth
In the last three fiscal years, Taylor Morrison Home Corp records the highest 3-year annual compounded growth rate of 68.52% in earnings per share.
All publicly traded homebuilders listed below have recorded compounded annual EPS growth rates of 20%+ in their last 3 Fiscal Years.
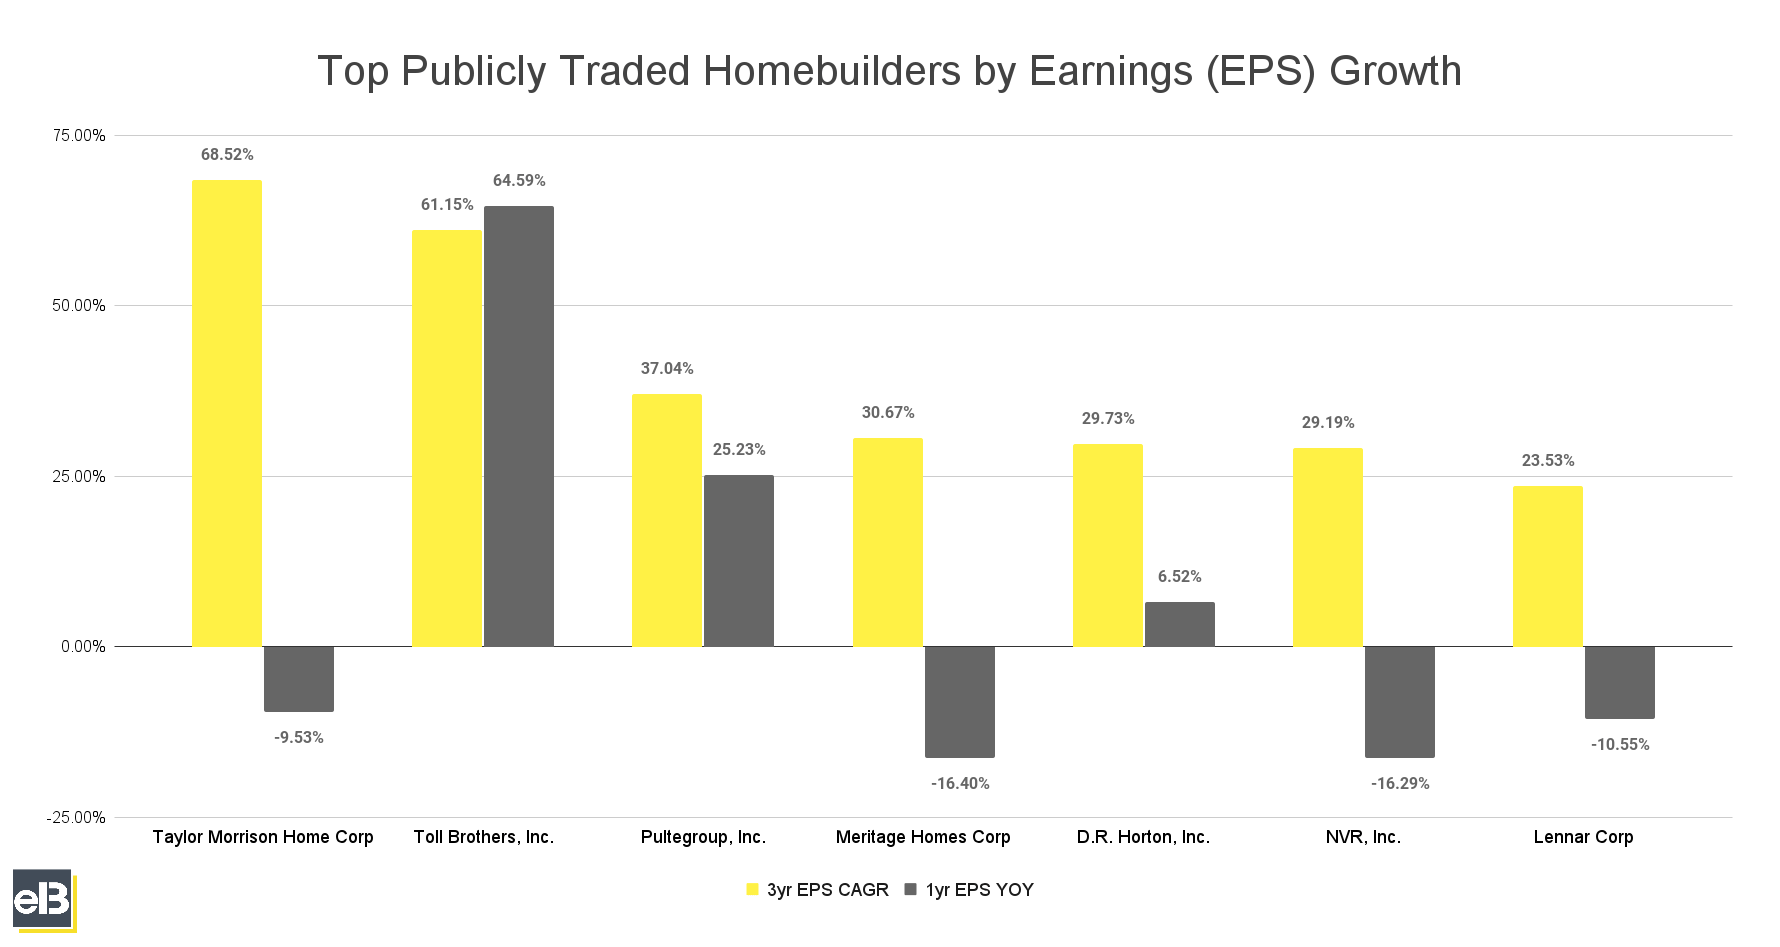
Among the companies in the above graph, Toll Brothers had the highest 1-year EPS YOY growth rate of 64.59%.
The highest 3-year EPS CAGR companies in the list are Taylor Morrison Home Corp at 68.52%, Toll Brothers at 61.15%, and Pultegroup at 37.04%.
| Company | 3yr EPS CAGR | 1yr EPS YOY |
| Taylor Morrison Home Corp | 68.52% | -9.53% |
| Toll Brothers | 61.15% | 64.59% |
| PulteGroup, Inc. | 37.04% | 25.23% |
| Meritage Homes Corp | 30.67% | -16.40% |
| D.R. Horton, Inc. | 29.73% | 6.52% |
| NVR, Inc. | 29.19% | -16.29% |
| Lennar Corp | 23.53% | -10.55% |
Key Takeaway
The homebuilding industry in general is a highly cyclical business and it shows in the wide swings in Earnings Per Share (EPS). The past three years has shown a good tailwind for the industry as the supply of homes is still short. However, the reacceleration of interest rates last year has hampered growth in the market alongside the typical seasonal slowing.
Homebuilders Revenue, Earnings and Stock Forecast (By Company; Quarter ending September 2023)
| Company | YOY EPS Forecast |
| D.R. Horton, Inc. | 4.49% |
| Lennar Corp | -8.32% |
| NVR, Inc. | -8.85% |
| PulteGroup, Inc. | -11.06% |
| Toll Brothers | 10.07% |
D.R. Horton, Inc. (DHI) Revenue, Earnings, and Stock Forecast
D.R. Horton, Inc. revenue over the latest Trailing Twelve Month period was $34.7 billion. D.R. Horton, Inc. earnings (Net Income) over the latest Trailing Twelve Month period was $4.7 billion.
The Wall Street consensus for D.R. Horton, Inc. EPS (earnings per share) projection for the next quarter is $2.88. The company’s TTM (trailing twelve months) Earnings Per Share was $13.90 as of the quarter ending September 30, 2023.
D.R. Horton, Inc. is expected to see an expansion in earnings per share of 4.49% YOY in the next quarter based on the consensus of stock market analyst forecasts.
Lennar Corp (LEN) Revenue, Earnings, and Stock Forecast
Lennar Corp revenue over the latest Trailing Twelve Month period was $32.5 billion. Lennar Corp earnings (Net Income) over the latest Trailing Twelve Month period was $3.9 billion.
The Wall Street consensus for Lennar Corp EPS (earnings per share) projection for the next quarter is $4.60. The company’s TTM (trailing twelve months) Earnings Per Share was $13.50 as of the quarter ending September 30, 2023.
Lennar Corp is expected to see a contraction in earnings per share of -8.32% YOY in the next quarter based on the consensus of stock market analyst forecasts.
NVR, Inc. (NVR) Revenue, Earnings, and Stock Forecast
NVR, Inc. revenue over the latest Trailing Twelve Month period was $9.6 billion. NVR, Inc.’s earnings (Net Income) over the latest Trailing Twelve Month period was $1.6 billion.
The Wall Street consensus for NVR, Inc. EPS (earnings per share) projection for the next quarter is $121.63. The company’s TTM (trailing twelve months) Earnings Per Share was $504.80 as of the quarter ending September 30, 2023.
NVR, Inc. is expected to see a contraction in earnings per share of -8.85% YOY in the next quarter based on the consensus of stock market analyst forecasts.
PulteGroup, Inc. (PHM) Revenue, Earnings, and Stock Forecast
PulteGroup, Inc.’s revenue over the latest Trailing Twelve Month period was $16.8 billion. PulteGroup, Inc.’s earnings (Net Income) over the latest Trailing Twelve Month period was $2.8 billion.
The Wall Street consensus for PulteGroup, Inc.’s EPS (earnings per share) projection for the next quarter is $3.23. The company’s TTM (trailing twelve months) Earnings Per Share was $12.40 as of the quarter ending September 30, 2023.
PulteGroup, Inc. is expected to see a contraction in earnings per share of -11.06% YOY in the next quarter based on the consensus of stock market analyst forecasts.
Toll Brothers, Inc. (TOL) Revenue, Earnings, and Stock Forecast
Toll Brothers, Inc.’s revenue over the latest Trailing Twelve Month period was $10.7 billion. Toll Brothers, Inc.’s earnings (Net Income) over the latest Trailing Twelve Month period was $1.6 billion.
The Wall Street consensus for Toll Brothers, Inc.’s EPS (earnings per share) projection for the next quarter is $12.00. The company’s TTM (trailing twelve months) Earnings Per Share was $14.10 as of the quarter ending September 30, 2023.
Toll Brothers, Inc. is expected to see an expansion in earnings per share of 10.07% YOY in the next quarter based on the consensus of stock market analyst forecasts.
Methodology
All data mentioned here in this article was sourced from publicly available filings and releases, and processed by investment newsletter provider, Sather Research, LLC.
Stock forecasts and analyst consensus EPS growth estimates were sourced from data provided by Seeking Alpha.
Contact Seoshin Chil at [email protected] for any further commentary, concerns, questions, or feedback. Alternatively, you can get in touch with the company during business hours through our contact page, or call 888-978-1348 from Monday – Friday; 9AM EST – 5:00 PM EST.

Seoshin Chil
Seoshin is an active sailor in offshore windfarm vessels but has a passion for studying great businesses and investing in them. Being always at sea does not stop him from doing so!
