Publicly available financial data collected by investment newsletter provider Sather Research, LLC showed that five Publicly Traded Home Builders by Market Cap grew Total Revenues on average 10.94% YoY in the October to December quarter, according to their Latest Earnings Releases.
Of the top publicly traded home builders who released Winter 2023 earnings results, the following five companies grew revenues 10.94% YoY on average: D.R. Horton, Lennar Corp, PulteGroup, Toll Brothers, and NVR, Inc.
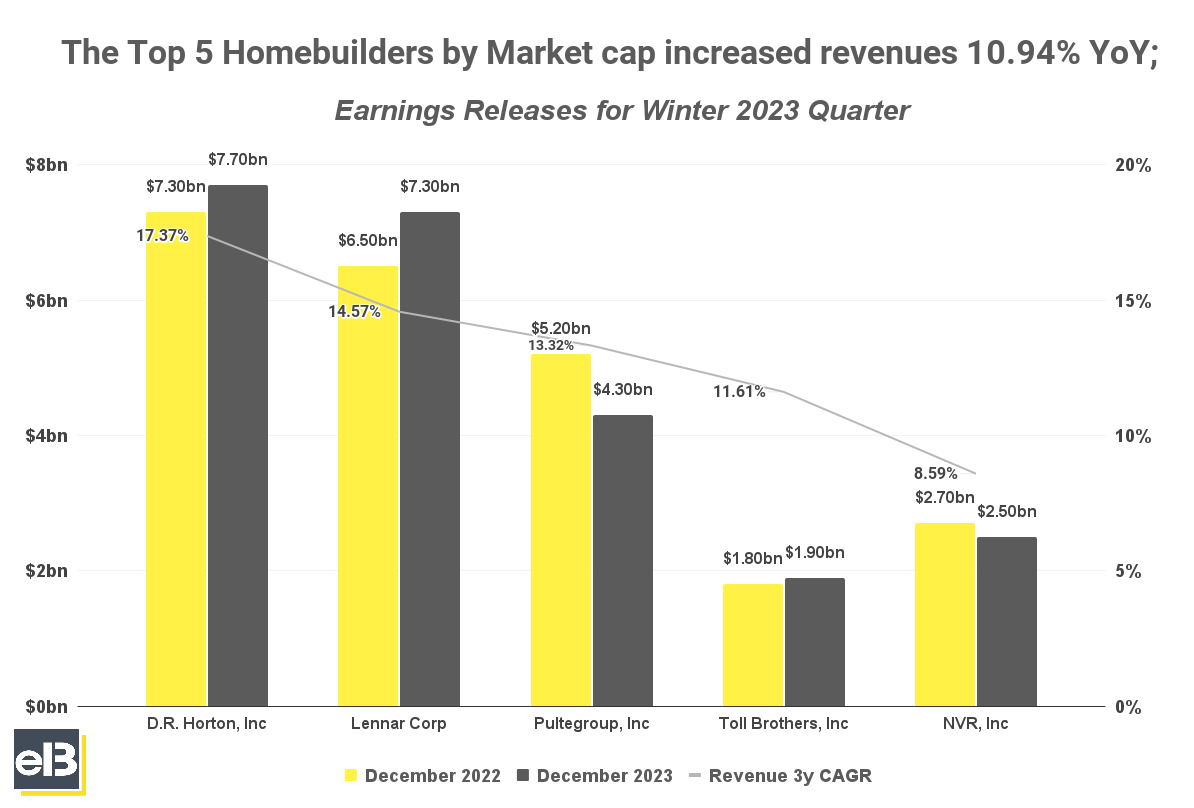
Lennar Corp stood out with the highest growth rate for Winter 2023 revenues at 12.70%, followed by Toll Brothers at 9.40%.
The following sections are covered in this report [Click to Skip Ahead]:
- Biggest Publicly Traded Homebuilders by Market Share
- Top Homebuilders By Revenue Growth
- Top Homebuilders By Earnings (EPS) Growth
Company revenues, earnings, and stock forecasts covered:
- D.R. Horton (DHI) Stock Forecast
- Lennar Corp (LEN) Stock Forecast
- NVR, Inc. (NVR) Stock Forecast
- PulteGroup, Inc (PHM) Stock Forecast
- Toll Brothers, Inc. (TOL) Stock Forecast
The list below only includes the top five Homebuilders by Market cap of >$10B. In the next section, all relevant publicly traded Homebuilders with >$3B in revenues are included.
| Company | December 2022 | December 2023 | YOY |
| D.R. Horton, Inc. | $7,257 | $7,726 | 6.50% |
| Lennar Corp | $6,490 | $7,312 | 12.70% |
| Pultegroup, Inc. | $5,171 | $4,293 | -17.00% |
| NVR, Inc. | $2,737 | $2,478 | -9.50% |
| Toll Brothers | $1,780 | $1,947 | 9.40% |
D.R. Horton reported a 35% increase YoY in net sales orders to 18,069 homes in December 2023, with a cancellation rate of 19% compared to 27% in the prior quarter. Homes closed in the quarter increased 12% to 19,340 homes compared to the same quarter last year. Homebuilding revenue also increased for the quarter by 8% to $7.3 billion compared to the previous quarter last year of $6.7 billion. However, sales order backlog decreased this quarter by –11%.
Lennar Corp saw revenues from home sales increase by 12.70% YoY which was due to a 23% increase in deliveries of 16,798 homes. Meanwhile, new orders also increased by 28% to 18,176 homes. Management commented that the housing market remained fundamentally strong as demand continued to outweigh supply as they expect to deliver between 19,000 to 19,500 homes in the next quarter.
PulteGroup recorded a -17% decrease in home sales revenues; however, new net orders increased by 57% to 6,214 homes compared to the previous same quarter, which leads to management being optimistic for the year 2024. Cancellations decreased by 9% compared to 11% in the prior year period.
NVR, Inc. reported an -11% decrease in homebuilding revenues compared to the previous same quarter, excluding financing-driven revenues. However, net sales orders continued to increase by 25% YoY to 5,190 units compared to 4,153 units in the same quarter 2022, with a cancellation rate decreasing by -13% for the latest quarter compared to 18% last quarter. The backlog of sold homes also increased on a unit basis by 12% to 10,229 units.
Toll Brothers increased their home sales revenues by 9.4% YoY while delivered homes were up by 6% to 1,927 homes with an average selling price of $1.0 million. Net signed contracts were also up 40% in units compared to same previous year quarter, however, backlog value was down -18% YoY with homes in backlog also down -13% to 6,693.
Key Takeaway
Although mortgage and inflation rates remain elevated, homebuilders in the recent quarter continued to enjoy a continued demand for homes as the supply of both new and existing homes at affordable prices remains limited, albeit not increasing that much already. Overall, homebuilders are optimistic in the trend as the housing supply remained chronically short due to production deficits over a decade and a healthy demographic to support.
Biggest Publicly Traded Homebuilders by Market Share
The graph below shows homebuilders with meaningful >$3B TTM revenues as of latest quarter of December 2023.
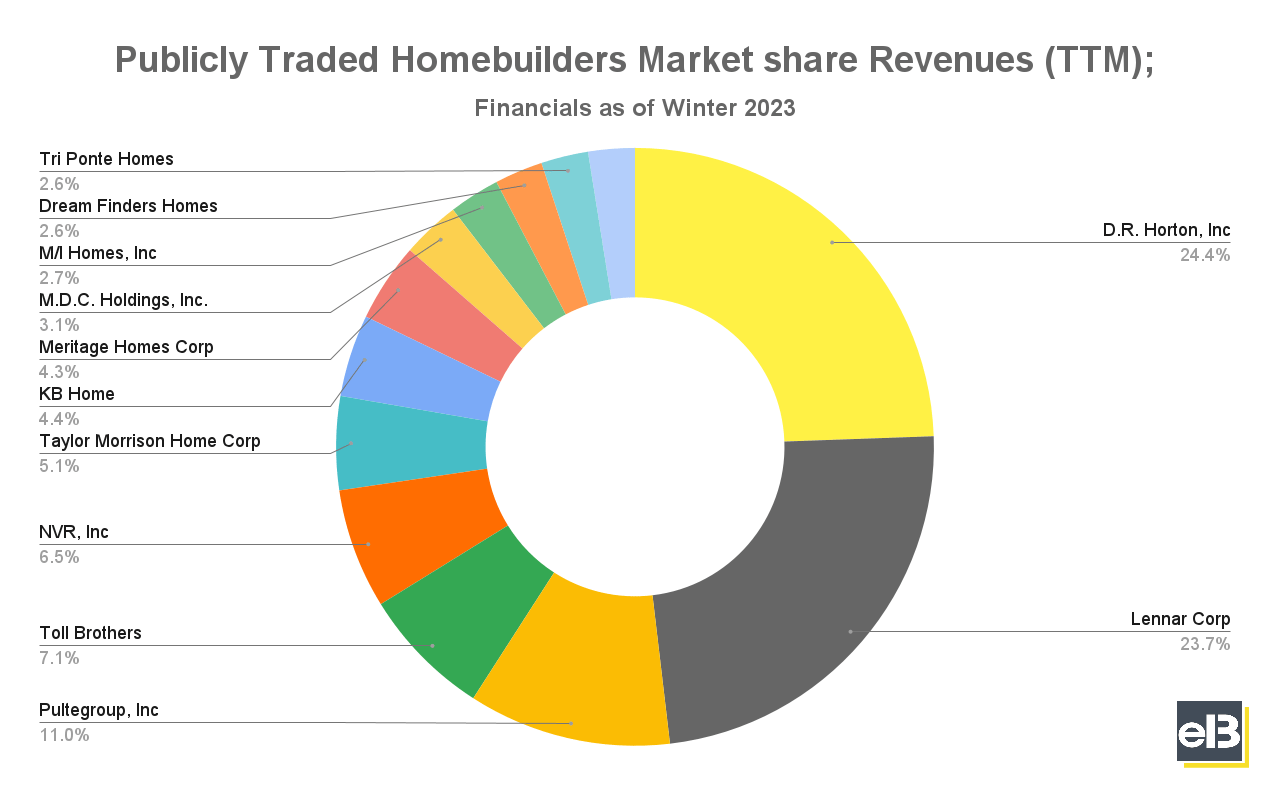
Leading the group is D.R. Horton, Inc. with roughly 24.4% market share, followed shortly by Lennar Corp with 23.7%, and trailing behind is Pultegroup, Inc. with 11.0% of Trailing Twelve Months (TTM) revenue share of all publicly traded homebuilders.
| Company | Revenues (TTM in Thousands | Mkt Share |
| D.R. Horton | $35,071,500 | 24.4% |
| Lennar Corp | $34,012,269 | 23.7% |
| PulteGroup, Inc. | $15,740,823 | 11.0% |
| Toll Brothers | $10,162,616 | 7.1% |
| NVR, Inc. | $9,314,605 | 6.5% |
| Taylor Morrison Home Corp | $7,257,519 | 5.1% |
| KB Home | $6,381,106 | 4.4% |
| Meritage Homes Corp | $6,113,013 | 4.3% |
| M.D.C. Holdings, Inc. | $4,520,296 | 3.1% |
| M/I Homes, Inc. | $3,939,673 | 2.7% |
| Dream Finders Homes | $3,738,888 | 2.6% |
| Tri Ponte Homes | $3,666,232 | 2.6% |
| Century Communities, Inc. | $3,611,962 | 2.5% |
Top Homebuilders by Revenue Growth
In the last three fiscal years, D.R. Horton Inc. led its peers in the homebuilding industry with a 17.37% compounded annual revenue growth rate.
Also, D.R. Horton Inc. is still ahead of 1-yr YoY revenues, growing revenues of 6.66% from 2022 to 2023; meanwhile, Lennar Corp trails behind with 3.23% 1-yr YoY revenue growth.
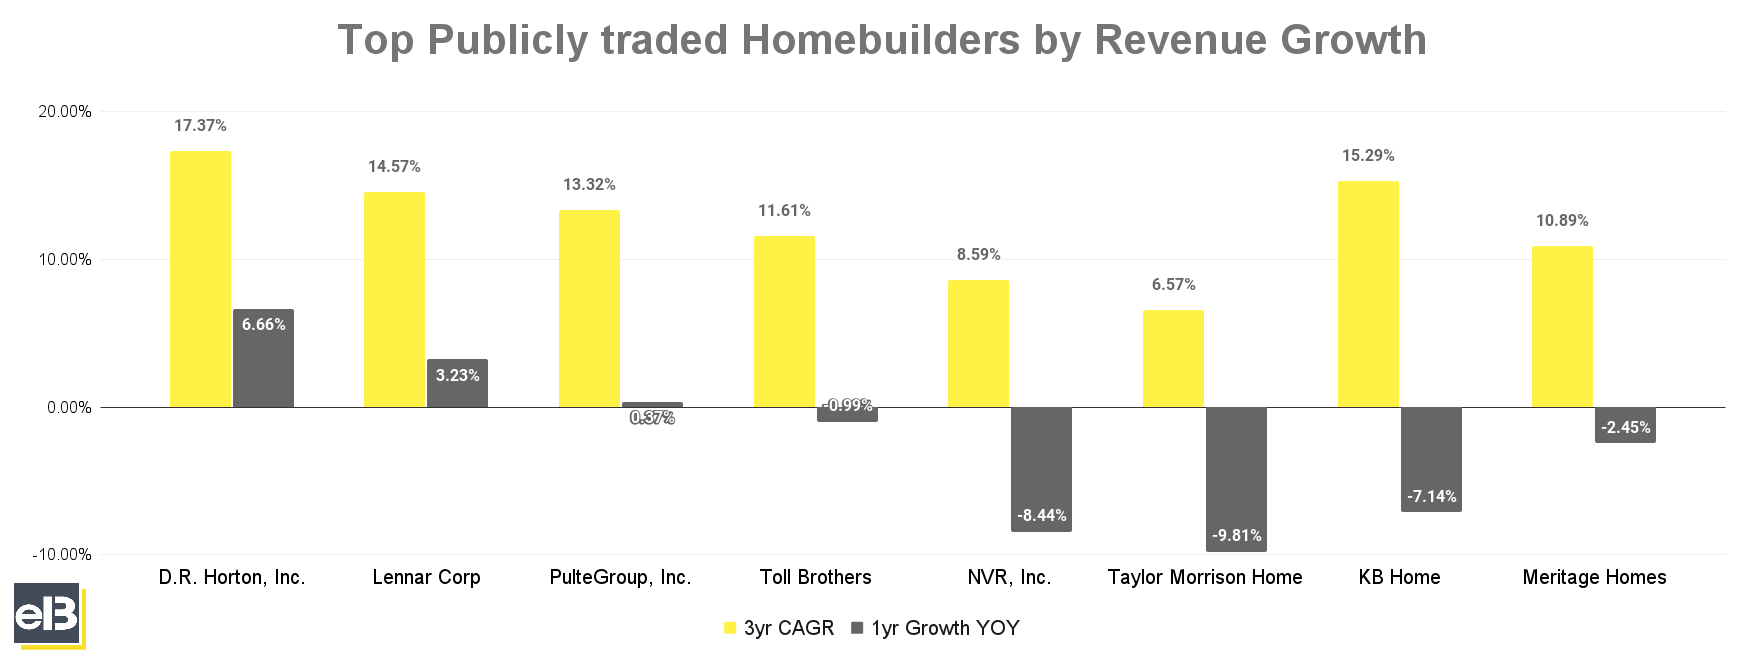
KB Home takes the number two spot in 3yr CAGR of 15.29%, followed by Lennar Corp and PulteGroup, Inc. with 14.57% and 13.32% 3yr CAGR, respectively.
| Company | 3yr CAGR | 1yr Growth YOY |
| D.R. Horton, Inc. | 17.37% | 6.66% |
| Lennar Corp | 14.57% | 3.23% |
| PulteGroup, Inc. | 13.32% | 0.37% |
| Toll Brothers | 11.61% | -0.99% |
| NVR, Inc. | 8.59% | -8.44% |
| Taylor Morrison Home Corp | 6.57% | -9.81% |
| KB Home | 15.29% | -7.14% |
| Meritage Homes | 10.89% | -2.45% |
Key Takeaway
The 3-yr revenue CAGR of homebuilders has been slowing down of late, which is evident from previous quarters as the cyclicality of the housing market hits the companies mentioned above. Also, the slowdown is apparent in the 1-yr revenue growth of homebuilders. However, most, if not all, homebuilders are optimistic for the year 2024 as net orders grew in recent quarters with cancellations also decreasing YoY. The demand and supply dynamic of the housing market can be complex to ascertain.
Top Homebuilders By Earnings (EPS) Growth
In the previous three fiscal years, Taylor Morrison Home recorded the highest 3-year annual compounded growth rate in earnings per share – 54.85%.
All publicly traded homebuilders listed below have recorded an average annual EPS growth rate of 20%+ in their last three Fiscal Years.
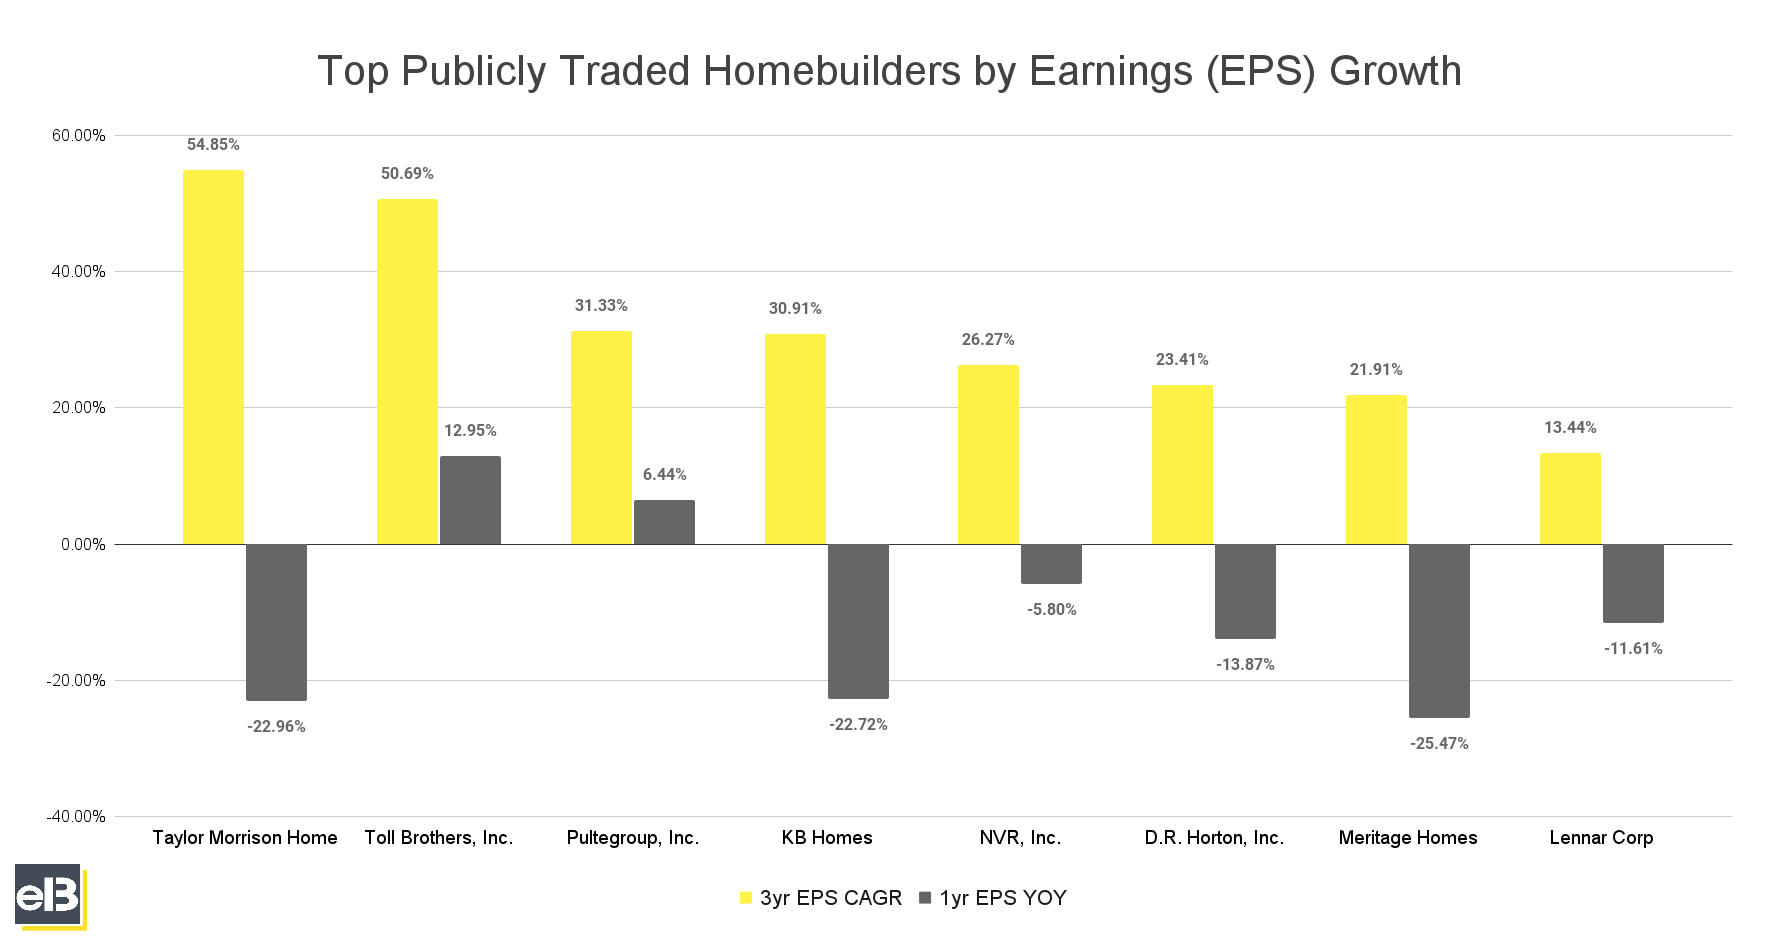
Among the companies in the above graph, Toll Brothers has the highest 1-year EPS YOY growth rate of 12.95%.
The highest 3-year EPS CAGR companies in the list are Taylor Morrison Home at 54.85%, Toll Brothers at 50.69%, and PulteGroup at 31.33%.
| Company | 3yr EPS CAGR | 1yr EPS YOY |
| Taylor Morrison Home | 54.85% | -22.96% |
| Toll Brothers | 50.69% | 12.95% |
| PulteGroup, Inc. | 31.33% | 6.44% |
| KB Homes | 30.91% | -22.72% |
| NVR, Inc. | 26.27% | -5.80% |
| D.R. Horton, Inc. | 23.41% | -13.87% |
| Meritage Homes | 21.91% | -25.47% |
| Lennar Corp | 13.44% | -11.61% |
Homebuilders Revenue, Earnings and Stock Forecast (By Company; Quarter ending December 2023)
| Company | YOY EPS Forecast |
| D.R. Horton, Inc. | 12.60% |
| Lennar Corp | 10.17% |
| NVR, Inc. | 3.54% |
| PulteGroup, Inc. | 0.15% |
| Toll Brothers | 41.62% |
D.R. Horton, Inc. (DHI) Revenue, Earnings, and Stock Forecast
D.R. Horton, Inc. revenue over the latest Trailing Twelve Month period was $35.9 billion. D.R. Horton, Inc. earnings (Net Income) over the latest Trailing Twelve Month period was $4.7 billion.
The Wall Street consensus for D.R. Horton, Inc. EPS (earnings per share) projection for the next quarter is $3.07. The company’s TTM (trailing twelve months) Earnings Per Share was $14.00 as of the quarter ending December 30, 2023.
Based on the consensus of stock market analyst forecasts, D.R. Horton, Inc., is expected to see an expansion in earnings per share of 12.60% YOY in the next quarter.
Lennar Corp (LEN) Revenue, Earnings, and Stock Forecast
Lennar Corp revenue over the latest Trailing Twelve Month period was $35.1 billion. Lennar Corp earnings (Net Income) over the latest Trailing Twelve Month period was $4.1 billion.
The Wall Street consensus for Lennar Corp EPS (earnings per share) projection for the next quarter is $3.24. The company’s TTM (trailing twelve months) Earnings Per Share was $14.30 as of the quarter ending February 29, 2024.
Lennar Corp is expected to see an expansion in earnings per share of 10.17% YOY in the next quarter based on the consensus of stock market analyst forecasts.
NVR, Inc. (NVR) Revenue, Earnings, and Stock Forecast
NVR, Inc. revenue over the latest Trailing Twelve Month period was $9.7 billion. NVR, Inc.’s earnings (Net Income) over the latest Trailing Twelve Month period was $1.6 billion.
The Wall Street consensus for NVR, Inc. EPS (earnings per share) projection for the next quarter is $103.43. The company’s TTM (trailing twelve months) Earnings Per Share was $491.50 as of the quarter ending December 30, 2023.
Based on the consensus of stock market analyst forecasts, NVR, Inc., is expected to see an expansion in earnings per share of 3.54% YOY in the next quarter.
PulteGroup, Inc. (PHM) Revenue, Earnings, and Stock Forecast
PulteGroup, Inc.’s revenue over the latest Trailing Twelve Month period was $16.1 billion. PulteGroup, Inc.’s earnings (Net Income) over the latest Trailing Twelve Month period was $2.6 billion.
The Wall Street consensus for PulteGroup, Inc.’s EPS (earnings per share) projection for the next quarter is $2.35. The company’s TTM (trailing twelve months) Earnings Per Share was $11.80 as of the quarter ending December 30, 2023.
Based on the consensus of stock market analyst forecasts, PulteGroup, Inc., is expected to see an expansion in earnings per share of 0.15% YOY in the next quarter.
Toll Brothers, Inc. (TOL) Revenue, Earnings, and Stock Forecast
Toll Brothers, Inc.’s revenue over the latest Trailing Twelve Month period was $10.2 billion. Toll Brothers, Inc.’s earnings (Net Income) over the latest Trailing Twelve Month period was $1.4 billion.
The Wall Street consensus for Toll Brothers, Inc.’s EPS (earnings per share) projection for the next quarter is $4.15. The company’s TTM (trailing twelve months) Earnings Per Share was $13.10 as of the quarter ending January 30, 2024.
Based on the consensus of stock market analyst forecasts, Toll Brothers, Inc.’s earnings per share are expected to expand 41.62% year over year in the next quarter.
Methodology
All data mentioned here in this article was sourced from publicly available filings and releases, and processed by investment newsletter provider, Sather Research, LLC.
Stock forecasts and analyst consensus EPS growth estimates were sourced from data provided by Seeking Alpha.
Contact Seoshin Chil at [email protected] for any further commentary, concerns, questions, or feedback. Alternatively, you can get in touch with the company during business hours through our contact page, or call 888-978-1348 from Monday – Friday; 9AM EST – 5:00 PM EST.

Seoshin Chil
Seoshin is an active sailor in offshore windfarm vessels but has a passion for studying great businesses and investing in them. Being always at sea does not stop him from doing so!
