Updated 6/3/2024
“Never invest in a company without understanding its finances. The biggest losses in stocks come from companies with poor balance sheets.”
Peter Lynch
The ability to read a company’s financials, such as the income statement, balance sheets, and cash flow statement, is a key data source for investors, both do-it-yourselfers and institutional investors.
As an investor, you don’t need to be an expert at deciphering financial statements and modeling, but at least being fluent in the accounting language will go a long way toward your success as an investor.
In our continuing series on understanding accounting and financial statements, we will unlock the secrets within the balance sheets.
The next focus is on the balance sheet and its components. Every company, as a public entity, must file a balance sheet, and its structure helps inform investors about a company’s financial strength.
Aside from financials such as banks and insurance companies, reading companies’ balance sheets is fairly straightforward.
Analysis of the balance can uncover clues to a company’s liquidity and ability to survive challenges such as those faced by businesses today.
In today’s post, we will learn:
- Breaking Down the Balance Sheet Structure
- Asset Side of the Equation
- Liability Side of the Equation
- Equity Side of the Equation
Let’s dive in and uncover more about the balance sheet structure.
Breaking Down the Balance Sheet Structure
The balance sheet remains one of the big three financial statements that all public companies must file. The others are the income statement and statements of cash flows.
The objective of the balance sheet (or statement of financial position) remains to provide information concerning a company’s assets and equity interests at a specific time.
Assets represent items of value the company owns and has in its possession. Or others that will be received and can be measured objectively.
Companies owe creditors, such as employees, suppliers, tax authorities, and liabilities. The liabilities are obligations with schedules, conditions, and time frames that govern when, how much, and how often the company pays the liabilities back.
Equity or shareholders’ equity consists of retained earnings and monies shareholders contribute in exchange for ownership.
We can best express the balance sheet as a formula. The formula equals:
Assets = Liabilities + Equity
The balance sheet formula remains important, and we should consider it this way: As sales grow, the asset base will grow as well. This dictates higher inventories, receivables, and fixed assets, like plant, property, and equipment. As the company’s assets grow, liabilities and equity grow in lockstep, and the financial positions must stay balanced.
How the assets are supported by financing or the corresponding growth in payables, debt, and equity tells us much about the company’s financial health.
When considering a company’s financial health, a good mix of liabilities and equity supporting the assets is a sign of a financially healthy company.
A simple view of the balance sheet equation is having assets equal to a smaller portion of liabilities supporting those assets while having a larger portion of equity than liabilities supporting those assets—keeping in mind that equity-creating revenues are cheaper than debt-creating revenues.
We want to consider the balance sheet equation because debt financing at higher levels lends more risk to your investment; as a company struggles, the possibility of defaulting on the debt rises, and the risk of bankruptcy also increases.
The balance sheet is a snapshot of any public company’s financial condition over time. Every quarterly or annual report will contain a balance sheet, and we need to think of those results as frozen in time and depending on the day.
Standard accounting practices allow for presenting the balance sheet in two formats:
- Horizontal presentation
- Vertical presentation
Most companies use vertical presentations; I have never seen a horizontal presentation in a public company. The vertical presentation doesn’t allow for the “balancing” of the sheet, as you don’t see the two sides balancing out like you would in accounting class.
Regardless of whether it is a horizontal or vertical presentation, all balance sheets conform to the presentation that presents the positions of account entries into five sections:
- Current assets
- Non-current assets
- Current liabilities
- Non-current liabilities
- Shareholders’ equity
Such that Assets equals:
- Current Assets
- Non-current assets
Liabilities: current liabilities + non-current liabilities + shareholders’ equity
As mentioned above, the balance sheets for utilities, banks, insurance companies, brokerages, and investment banks remain significantly different. They require further analysis and understanding of the terminology used for those businesses.
Another note about balance sheets: there remains little normalization of the nomenclature or naming of said sheets. For example, one company may refer to its balance sheet as a “statement of financial condition” or “financial condition.” Unfortunately, this disorder also applies to the accounts of balance sheets, so there is no uniformity in labeling accounts for the balance sheet.
Okay, let’s uncover each balance sheet section and define its different components.
Asset Side of the Equation
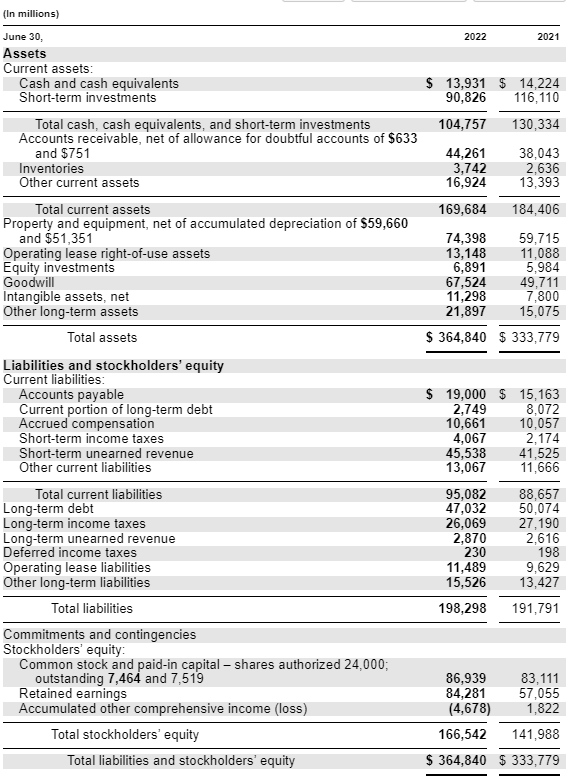
As we work through our balance sheet, we will use Microsoft’s (MSFT) as our example and their latest 10-k, dated June 30, 2022
For our analysis, assets drive a company’s economic resources. The company must have acquired the rights to said assets, and they are likely to continue contributing to Microsoft’s future net cash flows.
Items such as cash are unquestionably assets because they have purchasing power that represents a future economic benefit to Microsoft.
Let’s start to look at each component of the asset side of the equation of the balance sheet structure.
A note about the order in which we find the assets listed in the asset section: the accounts are listed in the order of liquidity or how quickly those assets can convert to cash. So, accounts receivable are more liquid than inventories, for example. The above point is important to remember when analyzing the company’s ability to meet its obligations.
The asset section of the balance sheet has two components, which we will break down by line items.
- Current assets
- Non-current assets
Current Assets
Current assets are the most liquid assets owned by the business and are the accounts or line items listed in order of liquidity.

Current assets can be considered assets that a company can liquidate within one calendar year. Consider inventory, for example, as something used up within one calendar year.
Current assets are important because they represent the funds a business can use to fund day-to-day operations for the next calendar year. We can also think of it as the liquid assets of the business.
Let’s next look at the accounts associated with current assets.
Cash and Cash Equivalents
These are the most liquid assets, appearing on the first line of the assets section. Cash equivalents are also in this line item. Cash equivalents contain securities that are extremely short-term, such as three months.
These securities are short-term bonds, money market accounts, or treasuries. The company wants to generate some income by using this account to generate a small amount of income from monies not used for the immediate future.
We can find More information regarding the cash equivalents in the notes section of the financials, typically listed as the marketable or investment section.
Microsoft lists $13,576 million in cash and cash equivalents. The company also lists the short-term investments separately, for which we can see a total of $122,951 million. Keep in mind that these securities are very short-term in nature, and the ability for quick liquidity is paramount.
Accounts Receivable
The accounts receivable accounts for all amounts owed to the company by customers that the company has not yet collected. The bad debt accounts or customers are unlikely to pay to subtract from this account.
This account decreases as Microsoft collects from its customers, and cash will increase by the same amount as collected.
Microsoft lists accounts receivable as $44,261 million.
Inventory
The inventory line item contains raw materials, work-in-progress goods, and finished goods. Think of inventories as goods waiting to be sold by the company, whether cars, computers, or phones.
In many companies, inventory might be the largest line item in the current asset section.
The costs associated with the production or acquisition of inventory are listed in the costs of goods sold line item of the income statement.
Microsoft lists inventories of $3,742 million under the current assets section.
Other current assets
Other current assets are typically smaller items listed under this catch-all section.
Items include advances paid to an employee, a piece of property listed for sale, or restricted cash or investments.
Microsoft is listing its balance sheet of $16,924 million of other current assets.
Non-Current Assets
These assets are items that the company uses for a longer life, such as property, plant, and equipment or intangible assets.
The non-current assets have a longer life, typically longer than at least a year, and include goodwill, among others.
Plant, Property, and Equipment (PP&E)
The PP&E line item represents the company’s fixed assets. It doesn’t include depreciation, and some companies list their PP&E on separate lines, such as plants.
The PP&E account will vary from company to company, and for many companies, this will easily be the biggest line item under non-current assets.
Microsoft lists the plant, property, and equipment of $74,398 million on the balance sheet.
Goodwill
Goodwill is probably one of the more controversial items on the balance sheet as it contains information that is not always the most transparent. It takes some sleuthing to determine what makes up the goodwill.
Typically, goodwill expresses the intangible amounts from an excess purchase of another company. Items contained in goodwill can be proprietary intellectual property or branding.
We can calculate goodwill by subtracting the market value of the assets and liabilities from the purchase price of the assets. Businesses must review the value of goodwill annually and record any impairments to the asset’s fair value.
The goodwill for Microsoft is $67,524 million for 2022.
Intangible Assets
The intangible asset line items include the company’s intangible fixed assets. Some of these items, such as patents, licenses, or a secret sauce or formula, may or may not be identifiable.
Microsoft lists intangible assets of $11,298 million on its balance sheet.
That concludes the asset section of Microsoft’s balance sheet; remember, the other side of the equation must balance the assets.
Let’s move on to the liability section of the balance sheet.
Liabilities Side of the Equation
Liabilities are the monies that the company owes to help support its assets. Think of them as accounts that support the purchase of inventory to sell the items the company sells.
Or they are financing those purchases for inventories, for example.
Remember that the accounting equation for the balance sheet means that the liabilities and shareholders’ equity must equal the assets for the financial statement to balance.
Let’s walk through some of the line items most commonly seen in the liability section of the balance sheet.
Current Liabilities
Current liabilities are short-term obligations due within the calendar year or operating cycle. They settle by using current assets, thus determining companies’ liquidity using ratios such as the current or quick ratio.
Examples of current liabilities include items such as:
- Accounts payable
- Short-term debt
- Dividends
- Notes payable
- Income taxes owed
Ok, let’s look at some of the more common current liabilities.
Accounts Payable
Accounts payable is the amount the company owes its suppliers for the goods or services it has purchased on credit from them. Accounts payable are expected to settle within the year of purchase and are considered the most liquid of all current liabilities.
Microsoft has an account payable of $19,000 million listed on its balance sheet.
Current Portion of Long-term Debt
The above line item refers to the short-term portion of long-term debt the company is due within the calendar or operating year. For example, if a company takes out a 10-year bank loan, the current portion of that loan is listed under this account.
For many companies, the short-term debt of bonds will be listed under this account; for example, any debt that is coming due for the current year will be on this line item.
It may also refer to short-term debt; again, there is no uniformity in the labeling of accounts, which can lead to some confusion.
Microsoft lists the current portion of long-term debt as $2,749 million.
Deferred revenue
The company lists this item as short-term unearned revenue on Microsoft’s balance sheet.
Consider it revenue the company has earned but not recognized as the sale has not been finalized according to accounting rules.
Microsoft lists short-term unearned revenue as $45,538 million on its balance sheet.
Non-current Liabilities
The non-current liabilities are longer-term liabilities having longer maturities over a year. Any long-term debt is listed under this line item and is a major source of investigation for investors.
Long-term debt
This account includes any long-term debt, except the current portion due if listed under the current liabilities. The long-term debt gets paid on a debt schedule, which outlines all of the company’s debt and indicates the schedule of payments, along with the interest expense, total debt due, and the schedule of the principal payments.
All information regarding long-term debt is listed under the notes section of the financial reports. Here, you will find everything you wish to know about the company’s long-term debt.
In the notes section, we find the schedule for debt repayment; this item can help you determine how much debt the company owes and when the debt comes due on a cash flow basis.
Microsoft lists long-term debt of $47,032 on the balance sheet.
Long-term income taxes
This account lists the unpaid or carrying amount of income taxes due for longer than one year—also known as income taxes payable.
Microsoft records this item as $26,069 million on its balance sheet.
With that, we will wrap up our summary of the liabilities section of the balance sheet.
To ensure our balance sheet balances, the shareholders’ equity section must equal the difference between the assets and liabilities.
So far, Microsoft has:
- Total Assets – $364,840 million
- Total Liabilities – $198,298 million
Equity Side of Equation
Also referred to as shareholders’ equity or stockholders’ equity, we have the owners’ claims on any assets after paying the debts. Think of it as the percentage of ownership of any assets left over after paying the debt owed on those assets.
Equity is equal to the firm’s assets minus the liabilities.
Shareholders’ equity can be positive or negative, depending on whether the company has more or fewer assets than liabilities.

If the company owes more liabilities than assets, its equity will be negative. Many investors, including yours, consider negative equity a risky proposition because it means the company owes more money than assets created for the company.
Share Capital
The share capital line item indicates the amount of money shareholders have invested in the company. Owners made this initial contribution when the company was first created.
They are also known as shareholders’ capital, equity capital, or common stock.
Microsoft lists this line item as $86,939 million on its balance sheet.
Retained Earnings
Retained earnings are the total amount of earnings that the company decides to keep after paying share repurchases, dividends, or paying down debt.
Every quarter, the company decides what to do with its earnings, whether it wants to return money to shareholders, pay down debt, or reinvest in projects to grow the company.
Any amount used to pay dividends, for example, is deducted from retained earnings, and any money left over is added to retained earnings.
Keep in mind that this is not an actual bank account but an accounting ledger that indicates how much it has to use for dividend payments, for example. The actual payment of dividends comes from the statement of cash flows, which is the business’s checking account.
We can find more information concerning the retained earnings in the stockholders’ equity statements, which also contain all the information regarding all items related to shareholders’ equity. That statement can give you more details on the dividend payments for the company, for example.
The retained earnings for Microsoft were $84,281 million for 2022.
That wraps up our summary of the shareholders’ equity section of the balance sheet.
To balance our statement, the shareholders’ equity section equals $166,542.
All of the sections then equal the following amounts:
- Total Assets – $364,840
- Liabilities – $198,298
- Shareholders’ Equity – $165,542
Liabilities ($198,298) + Equity ($166,542) = $364,840
Final Thoughts
Analyzing the balance sheet can give you great insight into the financial health of any company. Many investors focus on the balance sheets of businesses they buy because the balance sheet can tell you how strong the company is in the event of a downturn in the market.
Given the current condition of the stock market, studying balance sheets is paramount to determining the liquidity of businesses. Please think of the balance sheet as the financial statement that tells you how much money the company has on hand to create more assets, how much those assets will cost, and how much equity the company is worth.
Many metrics are associated with the balance sheet to help determine the strength and health of the company. Among them are:
- Return on Assets
- Return on Equity
- Return on Invested Capital
- Current Ratio
- Quick Ratio
- Debt to Equity
- Debt to Assets
- Asset Turnover Ratio
Learning the balance sheet structure and language of the line items and studying the balance sheet utilizing the above-referenced metrics and ratios can help you learn a lot about a company’s financial strength.
That is going to wrap up our discussion on the balance sheet structure.
As always, thank you for taking the time to read this post, and I hope you find something of value on your investing journey.
If I can further assist, please don’t hesitate to reach out.
Until next time, take care and be safe out there,
Dave

Dave Ahern
Dave, a self-taught investor, empowers investors to start investing by demystifying the stock market.
