Deposits are the lifeblood of banks, and loans are the means to generating income for the bank. The more deposits, the more loans, which leads to higher income.
After the Great Financial Crisis (GFC) from 2007 to 2009, there was a lot of focus on banks, rightfully so, with the meltdown causing bankruptcies and many banks running out of money. Because of that increased focus, there were regulatory restrictions in place in the form of the Dodd-Frank Act, along with more focus on liquidity and ways to measure that liquidity.
Stress tests, capital ratios such as CET1, Tier 1 ratios, and many more emerged with more importance after the GFC. And one of the biggest takeaways with the Covid induced depression was the greater liquidity of the banking industry. Initially, there was great fear of massive defaults, but those never materialized. Instead, the banking industry survived quite well.
One of the easiest ways to measure the liquidity of Bank of America is to look at the loan to deposit ratio.
In today’s post, we will learn:
- What is the Loan to Deposit Ratio?
- How Do We Calculate the Loan To Deposit Ratio?
- What is a Good Loan to Deposit Ratio?
- Current Levels of Loan to Deposit Ratios and Where to Find Them?
- Historical Ratios of the Money Center Banks + Large Regionals
- Investor Takeaways
Okay, let’s dive in and learn more about the loan to deposit ratio.
What is the Loan to Deposit Ratio?
The loan to deposit ratio, according to Investopedia, is:
“The loan-to-deposit ratio (LDR) is used to assess a bank’s liquidity by comparing a bank’s total loans to its total deposits for the same period. The LDR is expressed as a percentage.”
If Bank of America’s loan to deposit ratio is too high, it could indicate the bank is in danger of running short of liquidity. Likewise, if the ratio is too low, it could indicate the bank isn’t earning as much as it should.
Liquidity is a term used to indicate how easily a company can convert its assets into cash. In the event of an emergency, liquidity is an important ingredient to allow a business to deal with that emergency.
In the case of banks, having enough liquidity is paramount in a crisis, and cash is needed. If the bank doesn’t have enough liquidity, it could put the bank and system at risk. That was one of the biggest concerns during the Great Financial Crisis and led to the creation of stress tests that help test the amount of liquidity Bank of America has in a crisis.
The loan to deposit ratio is a quick, easy way to assess the bank’s amount of liquidity in a percentage form, making it easily relatable.
Let’s think about this for a moment. When a bank lends money to someone to buy a home, that loan isn’t always paid back. This leads to the loss on the loan; granted the bank could resell the home and recoup some of the loss. But the bigger issue is they lose out on the potential interest income, which is the bread and butter of banks.
Banks also have to repay deposits upon request, so if there is a run on a bank, having a large portion of their deposits out on loans means they have less cash on hand to satisfy the demand for deposits, putting the bank at risk.
Before diving into the calculations, let’s explore the idea of deposits and how banks lend that money out.
Most people think that when a bank takes a deposit, they can lend out that $100 from our savings account. In theory, that is true, but it is a touch more complicated. The usual mantra is without deposits; there would be no loans.
However, fractional reserve banking means that doesn’t apply anymore. Because of fractional banking, the bank can use the money multiplier to lend out more money than they have in reserve. Without going down a complete rabbit hole, keep this in mind. The bank has reserves of cash they are required to keep on hand or in their deposits.
The banks are then assigned a money multiplier based on their reserves, allowing them to lend out above their reserves. For example, if Bank of America has a reserve of 10%, they can lend out ten times more than their reserves. So the bank can lend out $1,000 from our $100 deposit.
As a general rule, deposits help drive loans, but the fractional banking system allows bigger loan balances, creating more income opportunities for the bank. Deposits aren’t the whole picture, but it is helpful to remember that more loans give more lending opportunities from a general viewpoint.
How Do We Calculate the Loan to Deposit Ratio?
The formula for calculating the loan to deposit ratio is as follows:
LDR = Total Loans / Total Deposits
To calculate the ratio, we take the total loans and divide them by the total deposits, all of which come from the bank’s balance sheet.
Total loans are found in the asset section, while deposits are in the liabilities section. That might seem counter-intuitive, but loans are assets because they generate income in the form of interest income. At the same time, deposits cost the banks money because they have to pay interest to encourage those deposits. The money is on-demand, which means that deposits must be returned to customers whenever they demand their money.
Let’s look at the ratio for Bank of America using their latest quarterly report, 10-q, dated April 29, 2021:

Pulling the information from the above balance sheet snippet:
March 31 | December 31 | |
Loans (A) | $886,920 | $909,059 |
Deposits (B) | $1,884,938 | $1,795,480 |
LDR Ratio (A/B) | 47.05% | 50.6% |
A note about the inputs for the calculations, the loans and leases contain the following loans:
- Residential mortgages
- Home equity loans
- Credit cards
- Direct/indirect consumer loans
- Commercial loans
Don’t let the lease term throw you off; they are not the same as the leases that Bank of America uses for office space, which is debt for the bank.
Notice also that the bank removes the loss reserves that the bank has to set aside for possible loan defaults. The Fed sets those loss reserves, and when the crisis passes, the bank is allowed to release part of that money back into the bank’s financials as income.
Let’s look at one more before moving to examine what the LDR ratio tells us.
Ally Financial (ALLY) recently reported its quarterly earnings, 10-q, dated March 31, 2021.
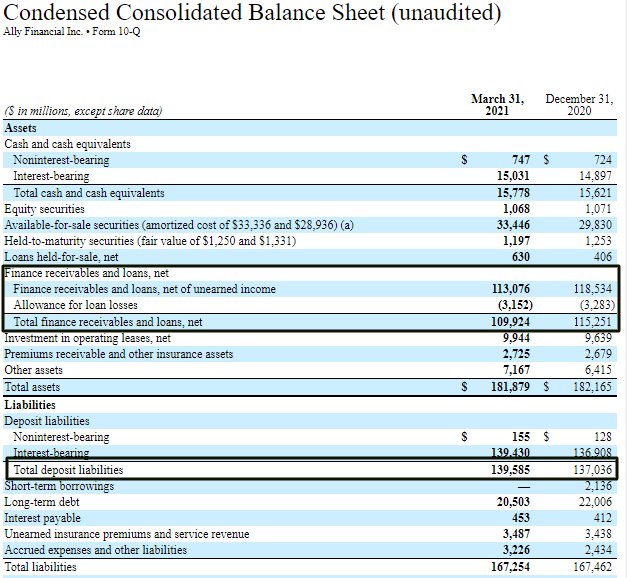
Now we can calculate our LDR ratio for Ally:
March 31, 2021 | December 31, 2020 | |
Loans (A) | $109,924 | $115,251 |
Deposits (B) | $139,585 | $137,036 |
LDR Ratio (A/B) | 78.7% | 84.1% |
Okay, that is pretty simple to calculate, now; let’s look at what a good ratio is and what the ratio tells us.
What is a Good Loan to Deposit Ratio?
Typically, the optimal ratio is 80% to 90%. A ratio above 100% means the bank has loaned out every dollar in deposits. It is the danger zone because it has no reserves to pay customers for demand deposits.
Regulations factor into the amount of loan to deposits the bank is allowed to lend, but these regulations don’t set minimums or maximums for the banks. However, the Fed and other agencies monitor banks to ensure they are keeping adequate reserves in place.
So our two examples above, Bank of America and Ally, had a wide range of ratios, with Ally’s closer to the ideal ratio. We will look at this a bit closer in a moment.
Investors can use the loan to deposit ratio as a quick measure of the banks’ liquidity. It also tells us how well the bank is attracting customers and retaining those customers.
For example, if the bank is attracting and retaining customers, their deposit levels will grow. In the case of Ally, the bank has grown deposits at 13.4% over the last ten years, while Bank of America has grown deposits at 5.9% over the same period.
As the deposits grow, the banks have more money to lend per the fractional reserve system. And the more lending, the more income the bank generates.
The loan to deposit ratio can also help us determine how efficient the bank is in attracting and retaining customers. If the bank is losing deposits or depositors, the bank will have less money to lend and less income.
To offset the decreasing deposit base, some banks will use financing to satisfy their loan demand, boost their interest income, and put the bank in a precarious situation by increasing its costs by adding interest expense, which might cost more than the increase in income. And by adding more debt, it puts itself in a poorer state financially.
Balancing the loan to deposit ratio is a tricky place for bank CEOs to operate. If a bank lends too much, it puts itself in an unsafe situation by having too few reserves in the event of a crisis. And if they don’t lend out enough, they run the risk of too little interest income.
One of the limitations of the loan to deposit ratio is it doesn’t account for loan quality. For example, if loan A has a credit rating of 650 versus loan B with a credit rating of 750, then loan B is a much stronger loan and more likely to pay back its principal plus its interest.
The ratio also doesn’t account for any loan defaults linked to the above credit quality. The poorer the credit quality of its loan portfolio, the more potential risk there is in defaults and loss of principal and income.
Assessing the credit quality of the loan portfolio is an essential practice when determining the risk to any bank. Plus, it also can tell us how likely the interest income will continue, and any risk of default to consider.
Current Levels of Loan to Deposit Ratios and Where to Find Them?
The Federal Reserve recently reported that the 25 largest banks in the US reduced their loan to deposit ratio to 53.9%, which is the lowest rate in 36 years, as of April 2021.
Overall total loans fell by $447 billion to $5.45 trillion, with total deposits increasing to $10.13 trillion, a gain of 16%. The Fed thinks that much of the increase stems from the increase in people’s savings, partly from stimulus payments and partly from lack of spending opportunities.
Much of the lending standards tightened over the past pandemic year, leaving little options for borrowing, combined with increasing savings rates have driven down the loan to deposit ratios for banks, but not all banks are seeing the impacts.
As we noticed from above, Bank of American saw a dramatic downturn in its ratio, while Ally saw theirs stable. With the banks flush with cash and businesses, there has been less demand for borrowing to fund inventories, mergers, acquisitions, and accounts receivables.
However, the housing market has been on fire recently, and experts expect that trend to continue through 2022 and demands ease up.
The Federal Reserve has a treasure trove of data available on their website, under the data tab. In there, we can find data on the largest banks in the system and others below the big banks.
Here there is data on loans, commercial loans, mortgages, deposits, and it is all listed over the last five years, with breakdowns of the last seven quarters so you can see the progress or declines over that period.
Another great resource of information is the Federal Reserve of St. Louis or FRED site. Here they have every kind of chart you could desire.

For example, from the above chart, we can see that in 2008 the banking system switched to the fractional reserve lending system, and deposits started to increase compared to loans, where before it was dollar for dollar.
Historical Ratios of the Money Center Banks + Large Regionals
Below is a chart outlining some of the money center banks plus the large regionals so you can see how the loan to deposit ratio fluctuates from year to year. The data comes from quickfs.net, who charts it out for us.
Bank | 2015 | 2016 | 2017 | 2018 | 2019 | 2020 |
JPM | 65.4 | 65.1 | 64.5 | 66.9 | 63.9 | 47.2 |
BAC | 73.8 | 70.9 | 70.7 | 67.7 | 67.8 | 51.2 |
WFC | 75.5 | 74.6 | 71.8 | 73.9 | 73.1 | 64.7 |
C | 67.7 | 67.0 | 69.3 | 67.4 | 65.2 | 52.7 |
USB | 84.4 | 79.6 | 77.9 | 79.5 | 79.4 | 68.1 |
TFC | 91.9 | 90.5 | 92.0 | 93.1 | 93.0 | 80.7 |
PNC | 80.6 | 80.0 | 81.2 | 82.1 | 81.0 | 64.9 |
FITB | 86.8 | 85.6 | 85.7 | 84.8 | 84.7 | 69.5 |
ALLY | 168.0 | 150.6 | 131.9 | 122.7 | 106.3 | 86.8 |
FRC | 92.1 | 89.4 | 91.3 | 96.1 | 100.8 | 98.0 |
The chart above helps us see some context on the historical loan to deposit ratios over the last six years, plus you can see how they compare across market caps of banks, starting from the biggest JP Morgan to First Republic Bank.
Investor Takeaway
Bank liquidity is a big deal for banks, and using a ratio like a loan to deposit helps you see quickly how liquid your bank is, plus it gives us an idea of how efficiently managed the bank.
The ratio is straightforward and easy to calculate, taking information from the balance sheet. Along with the capital ratios like Tier 1 and CECL, we can determine how liquid a bank is, plus we can determine how well capitalized the bank and how likely they are to grow their deposits and loans.
It is best to calculate it yourself from the source materials, the quarterly (10-q) or annual (10-k) filings. But if you are in a pinch, quickfs.net lays it our for every bank in their system. As always, it is best to look at it over a period of years to normalize the information, to help smooth out abnormal years.
And with that we will wrap up our discussion on the loan to deposit ratio.
As always, thank you for taking the time to read today’s post, and I hope you find something of value on your investing journey. If I can be of any further assistance, please don’t hesitate to reach out.
Until next time, take care and be safe out there,
Dave

Dave Ahern
Dave, a self-taught investor, empowers investors to start investing by demystifying the stock market.
