Would you rather buy low, sell high, or buy high, sell low? Obviously, we’d all like to buy low and sell high, but sometimes that desire makes us believe that doing the opposite is so wrong. Well, today, let’s debunk that idea using real data from the S&P 500.
I think you’ll find this very interesting, and hopefully, it will motivate many investors out there to take action. Keep the right mindset: time in the market is better than timing the market.
Click to jump to a section:
- The Usual Advice
- You Don’t Need to Time it Perfectly
- The Worst Case Scenario: Buy High, Sell Low
- Timing the Market is Overrated
The Usual Advice
“Buy low, sell high” – the most common stock buying advice ever. It’s sooooo easy, right? Wrong.
How do you know when you’re at the high point? If you buy a stock at $100 and it goes to $150, is that the high point where you should sell? If you sell, it will probably go to $200. If you don’t sell, it will probably come back to $100. It’s so tough to tell when the right time to sell is, and it’s just as hard to find out when to buy. Depressed yet? Don’t be. I have some good news.
You Don’t Need to Time it Perfectly
You can buy high and sell low and still make a ton of money!
“Andy, I think you said that backwards.” Nope, I didn’t. I meant what I said. Don’t believe me? That’s fine. The proof is in the pudding.
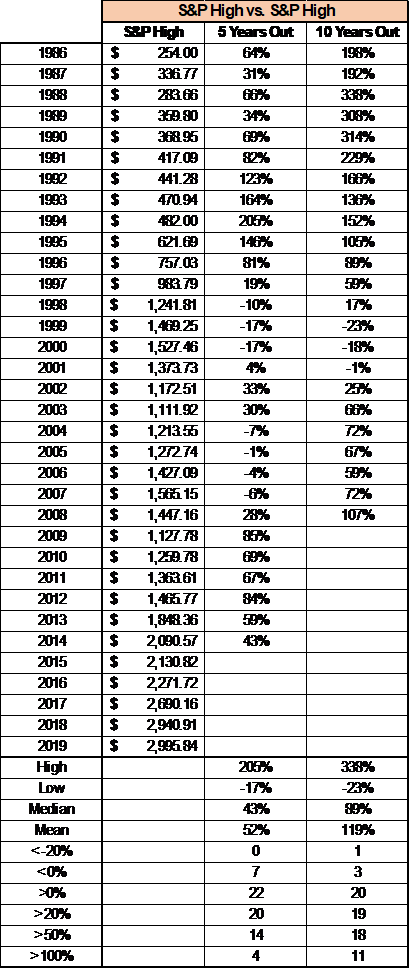
I went back and looked at the S&P 500 and ran various comparisons. All comparisons are based on buying one share of the S&P 500 and selling that one share. The first table shows what would’ve happened if you bought one share of the S&P 500 at the highest price each year and then sold at the highest price (buy high, sell high) for both 5 and 10 years later:
As you can see, your median return is 43% and 89% (5-year and 10-year), while the average is 52% and 119%. Not too shabby at all for buying high.
The worst case you’d run into was if you bought for $1,527.46 in 2000 and sold for $1,272.74 in 2005, a return of -17%. Definitely not a good return, but only 7/29 years had a negative 5-year return.
The best returns you would see in this time period were 338% (WOW!) from buying in 1988 and selling in 1998.
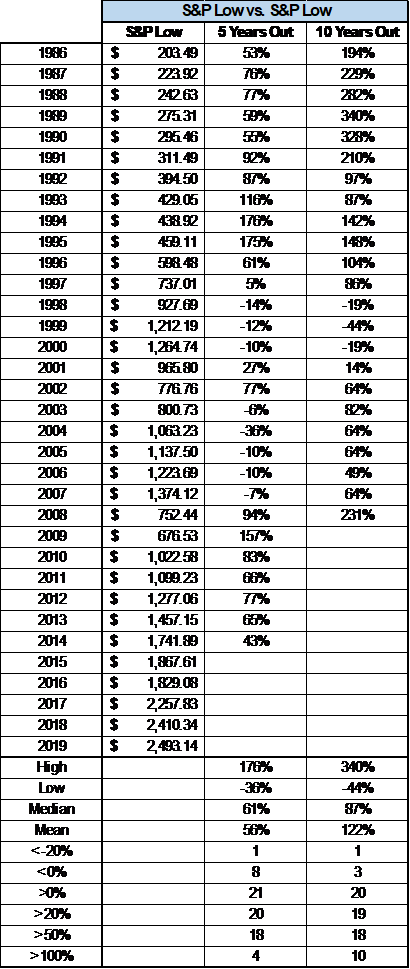
Now, let’s take a look at buying low and selling low:
Again, returns are pretty dang good. Median returns are 61% and 87% (5 & 10 year) and Mean returns are 56% and 122%.
These returns, for the most part, look very similar to buying high and selling high. 1989 had the best 10-year return of 340%, and 1999 had the worst 10-year by selling in 2009 in the market crash.
The Worst Case Scenario: Buy High, Sell Low
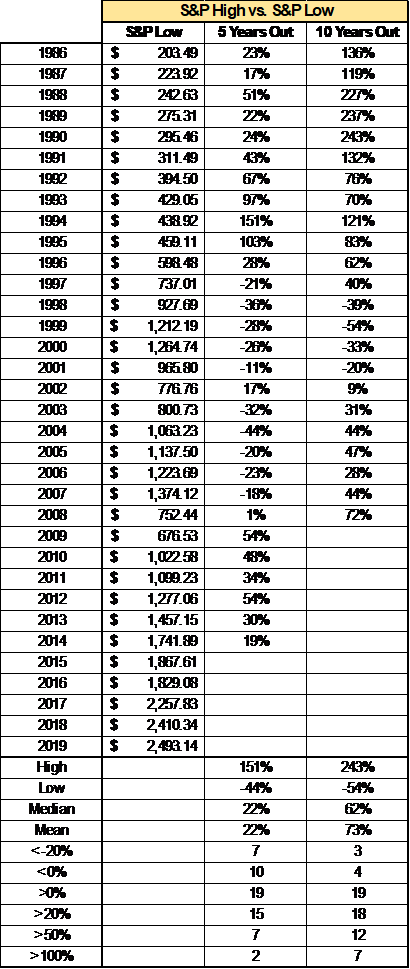
Now, this info is great and all, but this article was about buying high and selling low – AKA, timing the market in literally the worst way possible. Like, you couldn’t have done worse if you tried. Let’s take a look:
I love this so much. Your median returns are an average 22% and 62% (5 & 10 year) and mean returns are 22% and 73%. This tells me two things:
- That return is still better than you can achieve in most other ways, especially better than sitting in a bank account – even a high-yield savings account
- You need to buy and hold. 10-year returns are about 3x better than the 5-year returns for both the mean and the median. That’s really sending a strong message. Don’t sell when times are tough – the market is telling us that it will rebound.
Timing the Market is Overrated
All in all, the message is pretty clear – don’t try to time the market. You don’t need to. This is the beauty of dollar cost averaging.
Set your account up so that you put in a certain amount of money from each paycheck. This allows you to ensure that you’re never putting it all in at a high price and is a great form of protection.
If you buy a share of the S&P 500 ETF (SPY) at $300, and then two weeks later, you buy a share at $275, you should be happy! Don’t think of it that your first share just lost $25. Think of it that you just brought your average cost down by $12.50 ($300 + $275 = $575. $575/2 = $287.50 average cost).
The lower you get your average cost, the more you will make when it eventually recovers. The market always recovers in the long run.
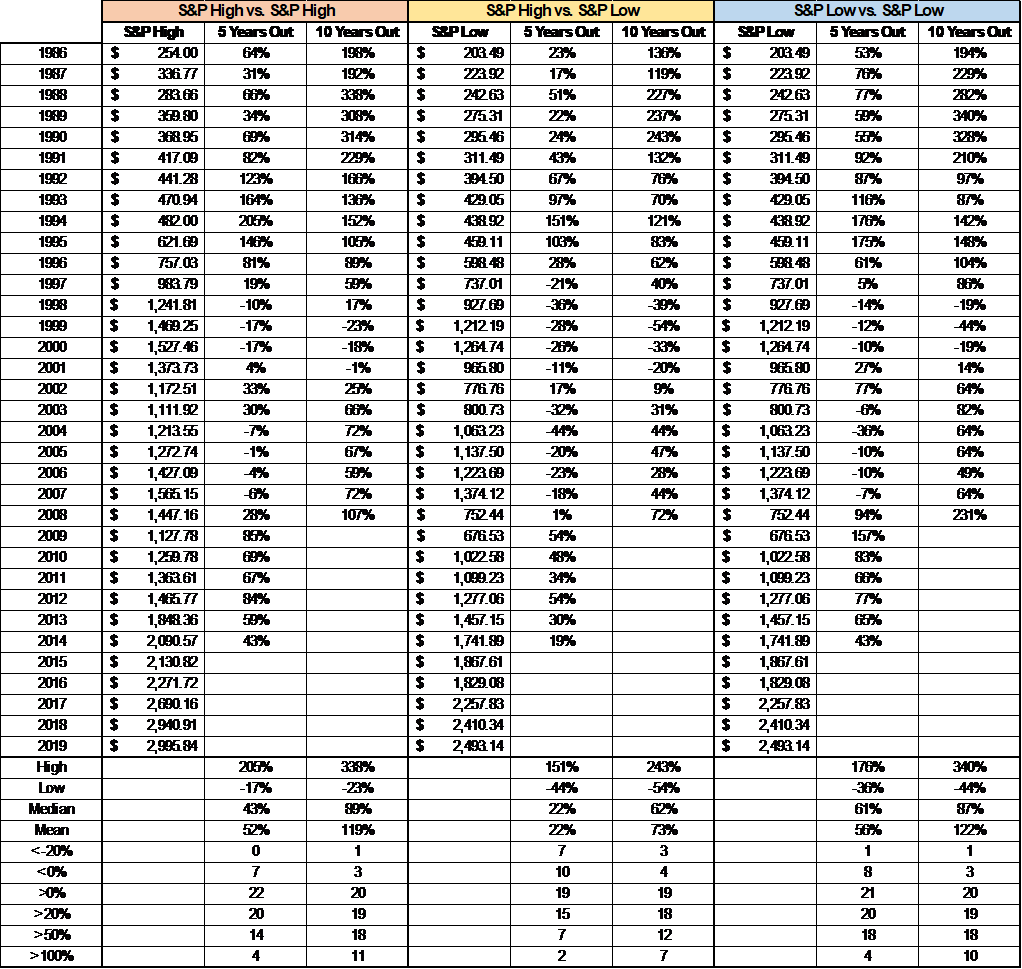
Below is the entire chart, so you don’t have to piece the three charts together.
It’s a very hard mentality, but I’m to the point where I like it when my stock picks drop because if I liked the stock enough to buy it at a higher price, then I definitely want to buy it when it’s lower.
Don’t time the market – jump in headfirst, and let the rest take care of itself for you – the worst-case scenario of buying high and selling low still seems like a pretty good scenario to me.
Related posts:
- The History of Stock Market Volatility in the United States I’m going to need you to buckle your seatbelts and get ready…this is going to be an extremely bumpy ride as I take you through...
- Should Investors ‘Buy the Rumor, Sell the News’? Have you ever heard the saying “buy the rumor, sell the news?” I hadn’t heard it before until Dave said it on an episode of...
- Buy Limit, Buy Stop, Buy Market – A Tale of Order Types It was the best of trades, it was the worst of trades (mostly worst). This is a cautionary tale of how an order type (buy...
- Beginner’s Guide to Finding High ROIC Stocks Anytime You Want Updated 5/4/2023 Investors target high ROIC stocks for their portfolio because highly efficient companies can sustain higher long-term growth. Companies with a high ROIC tend...

