Updated 1/5/2024
“Focus on return on equity, not earnings per share.”
Warren Buffett
In the investing world, there always seems to be a big divide between “value and growth,” deep value (cigar butts) and quality value, and many others. Buffett notes throughout his Shareholder Letters that both sides of the coin can coexist; focusing on the company’s returns and returns on equity helps you find long-term winners.
And as Buffett points out, many investors can do well by buying great businesses at fair prices and holding them for a long time.
In contrast, other investors who prefer the slower, steadier method can do well by buying cheap stocks of “so-so” quality and selling them as they grow to fair value—and then repeating the process over time as the cycle progresses, offering new prospects.
The styles and tactics differ, but using a metric like return on equity can help investors find companies selling for less than their worth.
In today’s post, we will learn:
- How To Calculate Return on Equity with a Calculator
- Why Do We Calculate Return on Equity Formula?
- Examples of Return on Equity Using Real-World Companies
- The Return on Equity Vs. Cost of Equity
- Drawbacks to Using Return on Equity Formula
Okay, let’s dive in and learn more about the return on equity formula.
How To Calculate Return on Equity with a Calculator
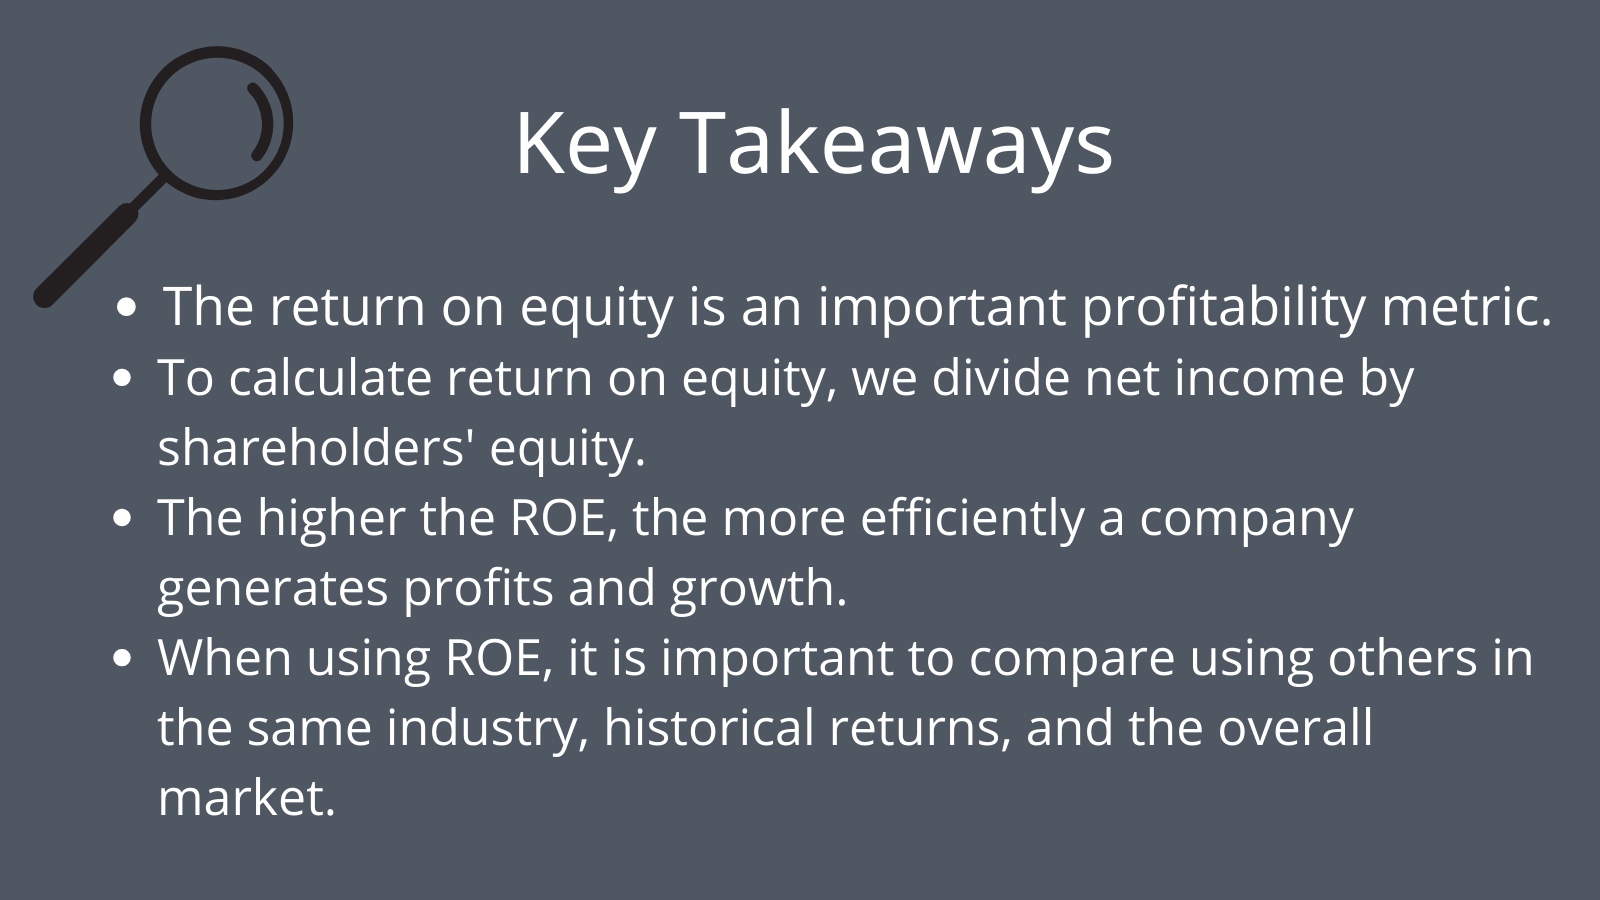
Return on equity or ROE measures profitability, comparing its net income to its shareholders’ equity.
The metric answers the question:
How much profit does the company generate from each dollar of equity shareholders invest?
For example, a return on equity of 10% tells us the company produces $1 of profit for each $10 of shareholders’ equity invested in the company.
Return on equity turns a percentage of invested equity on a dollar basis into net income (earnings). The ratio helps show how efficiently the company works with the investor’s equity, and the higher, the better.
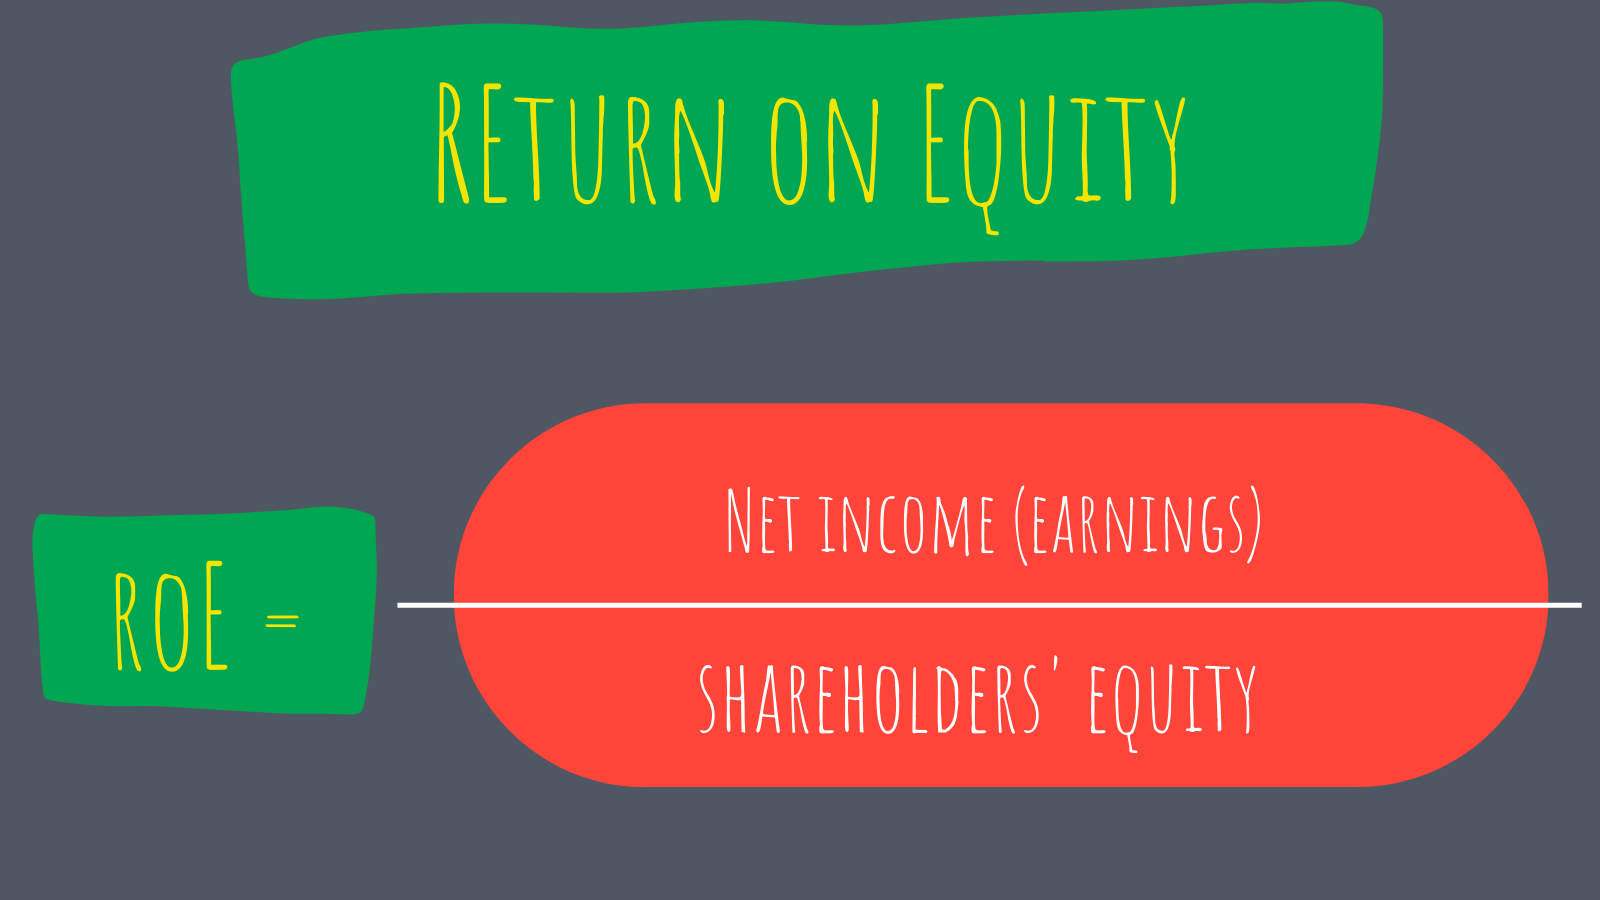
The return on equity formula combines the income statement and the balance sheet, comparing net income or earnings to the shareholders’ equity.
Because the return on equity formula doesn’t include the impact of debt, it can also be considered a return on net assets. To arrive at shareholders’ equity, we subtract assets and debt.
The two components of the return on equity formula:
- Net income comes from the income statement, also called earnings or the bottom line. Free cash flow (FCF) is another form of profit that can substitute for net income and earnings before interest and taxes (EBIT).
- Shareholders’ equity comes from the balance sheet and represents the balance sheet formula of assets = liabilities + shareholders’ equity, where shareholders’ equity is assets minus liabilities. The shareholders’ equity correlates to the value left over after selling the assets to satisfy the liabilities.
Investors can also calculate the return on equity formula at different periods to measure its change in value over time.
By comparing the ROE’s change in growth over the years, we can see the management’s results and any increases or declines in black and white.
Why Do We Calculate the Return on Equity Formula?
As mentioned above, return on equity is a ratio that helps investors and management determine how efficiently a company generates profit from its equity.
The higher the return on equity, the more efficiently a company generates income and growth from its equity financing.

Investors often use returns on equity to compare companies to their competitors and the overall market. The return on equity formula benefits investors when comparing companies in the same industry or sector by indicating which companies operate efficiently. And for evaluating companies with primarily tangible assets compared to intangible assets.
The ROE provides investors with a simple metric for evaluating returns. By comparing Walmart’s ROE to the industry’s average, we can help pinpoint Walmart’s possible competitive advantage or moat.
Returns on equity also give us insight into how Walmart uses equity financing to grow the business.
A company with a sustainable and growing ROE over time can indicate a company generating shareholder value because Walmart knows how to reinvest its earnings well, increasing productivity and profits, for example.
In contrast, a falling ROE can mean that Sears or Kmart made poor decisions by reinvesting capital in unprofitable assets.
The return on equity formula is a simple formula consisting of net income divided by shareholders’ equity. But we can break the formula down into additional components of value.
These drivers encompass the company’s return on assets and the amount of financial leverage the company carries.
The Dupont Analysis can help investors break down the different components of return on equity and help us better define what drives the company’s value.
Why use the return on equity metric?
ROE allows investors to see whether they are getting a good return on their investment. And it allows the company’s management to evaluate how efficiently they use its equity.
Remember that comparing ROE in isolation means little. Instead, we must compare it to others in the same industry and the overall market (S&P 500).
Examples of Return on Equity Using Real-world Companies
If the net income and equity are positive numbers, the return on equity expresses its results as a percentage. We pull the net income from the company’s income statement and the shareholders’ equity from its balance sheet to calculate the ratio.
Regarding the shareholders’ equity, it is good to use average shareholders’ equity over a calendar year (12 months) to avoid the mismatch between the income statement and the balance sheet.
The averaging of equity makes sense because the increase or decrease in equity may help explain the growth or decline in net income.
Let’s put this stuff into action.
Let’s use Microsoft’s latest annual report (10-k) as our guinea pig, filed on 7/29/2021. All numbers listed are in millions unless otherwise noted.
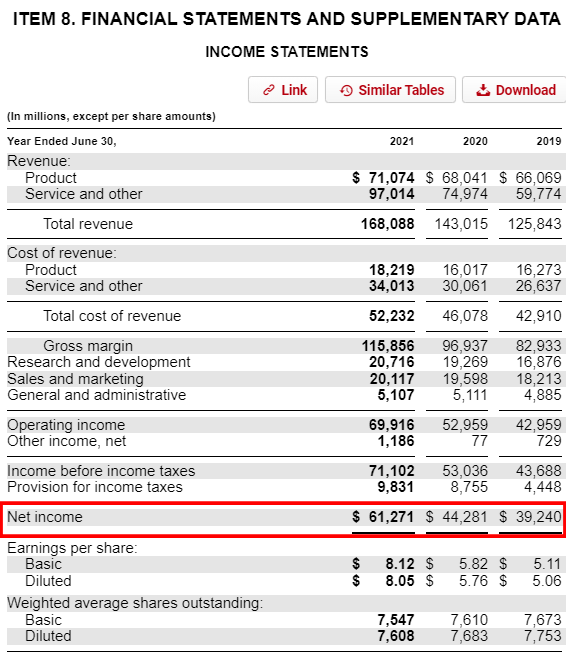
Our net income from the latest 2021 10-k equals $61,271 million.
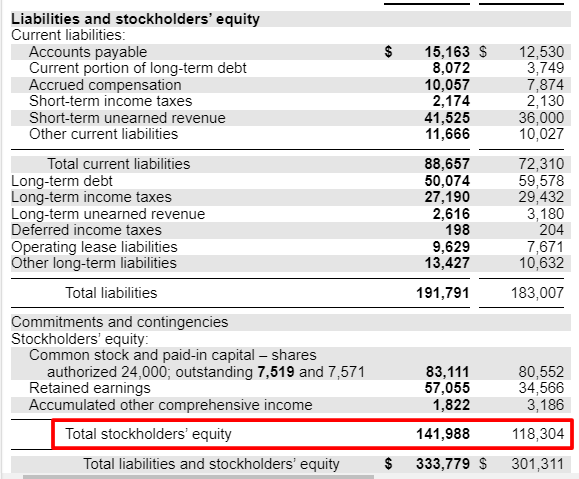
The total stockholders’ equity from the latest 10-k equals:
- 2021 – $141,988 million
- 2020 – $118,304 million
Then, to average, we add them up and divide by two, giving us the following:
Average shareholders’ equity = ($141,988 + $118,304) / 2
Average shareholders’ equity = $130,146 million
Now, we can calculate the return on equity formula from Microsoft’s financial statements.
Microsoft Return on Equity = $61,271 / $130,146 = 47.07%
The calculations show that Microsoft generates $47 of income for each $100 of equity.
Let’s try another one using Google’s financial statements filed 2/1/22.
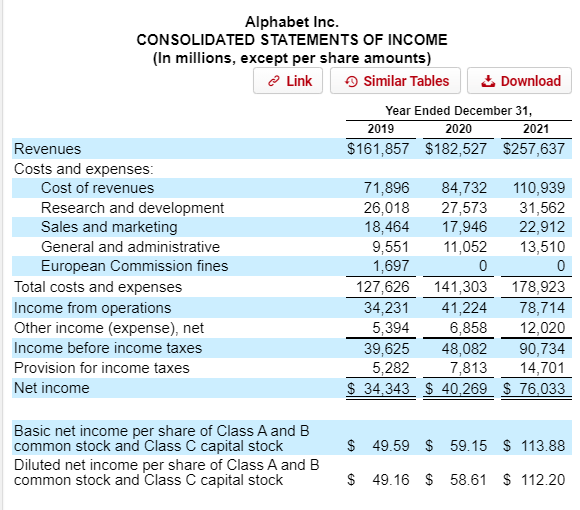
Google’s net income for 2021 equals $76,033 million.
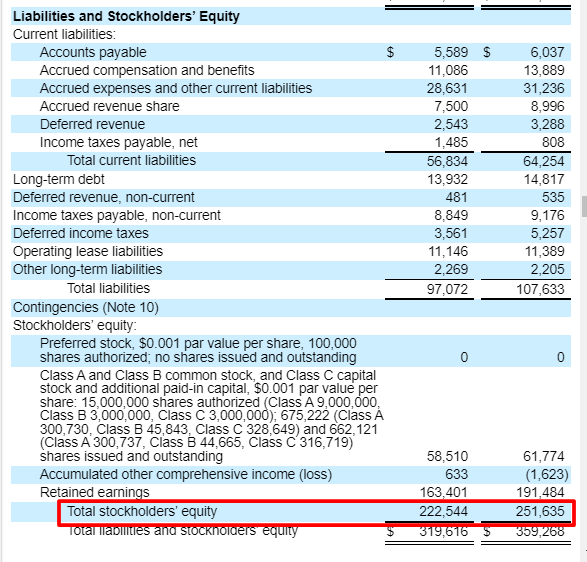
And the company’s stockholders’ equity for 2020 and 2021 equals:
- 2020 – $222,544 million
- 2021 – $251,635 million
They are giving us an average shareholders’ equity of $237,090.
We can now plug Google’s above numbers into the return on equity formula.
Google return on equity = $76,033 / $237,090 = 32.06%
The math tells us that Google creates approximately $32 profit from each $100 equity. Those numbers are good, but not as good as Microsoft, which competes with Google, particularly in the cloud and office productivity apps (Word vs. Sheets).
As discussed earlier, a good habit remains to compare Microsoft’s returns to competitors, historical performance, and the overall market.
Let’s compare Microsoft’s latest returns on equity to others in the same sector to see how they stack up.
- Microsoft
- Amazon
- Adobe
- ServiceNow
- Crowdstrike
- Datadog
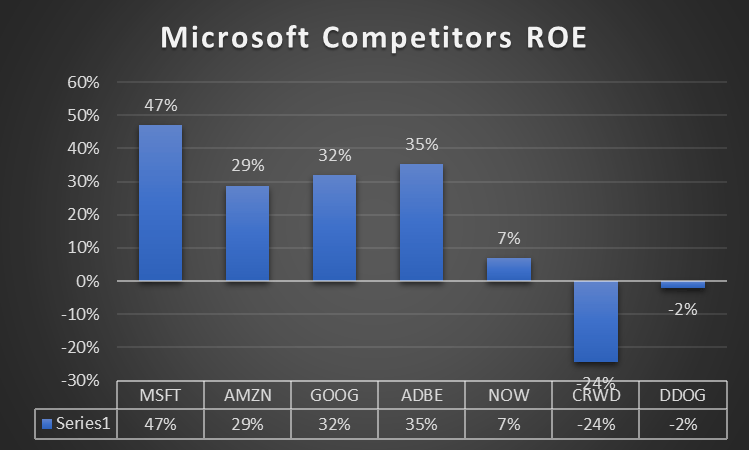
As seen from the above chart, Microsoft appears to do the best job of generating profit from its shareholders’ equity. The three laggards are newer to the space, having recently gone public, but each generates tremendous revenue growth and should become more profitable in time.
Next, let’s compare Microsoft’s recent return on equity to a longer time horizon, say ten years.
Courtesy of Tikr.com, the chart below highlights Microsoft’s ROE over ten years. We can see from the chart below that the company struggled in the early 2010s but began to transform once Sayta Nadella took charge and began the shift to a cloud-based company.
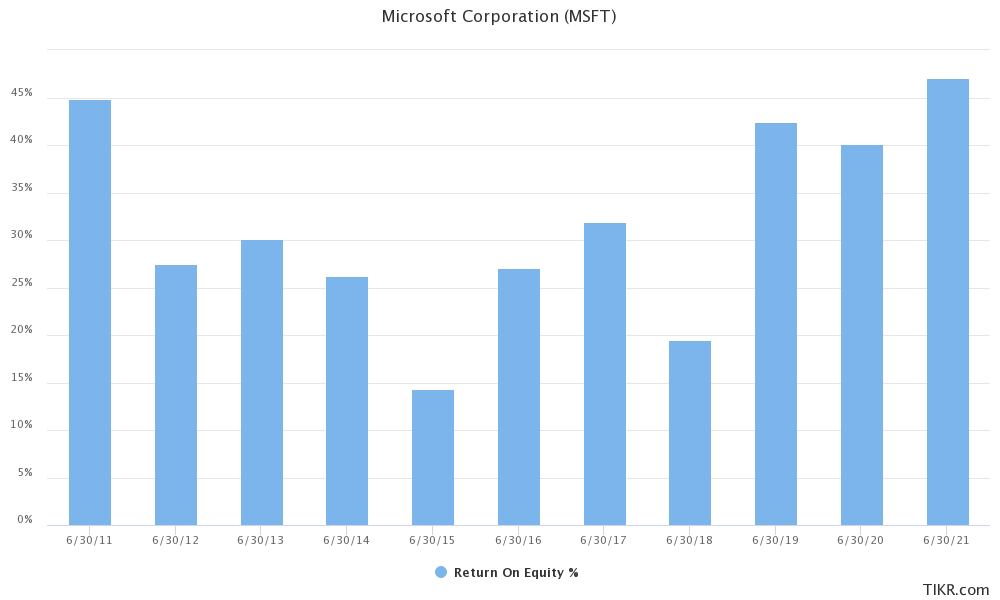
Once that shift began in 2014 when Nadella took control, the investments to grow the cloud platform took time to come to the fore, but once they did, revenues exploded, driving up returns.
And finally, we can compare Microsoft’s ROE to the overall market’s returns (S&P 500), which returned 18.12% in 2021, indicating that Microsoft’s returns outperformed the markets.
The above process outlines how you should analyze a company’s return on equity and whether or not it is good.
We can see how the company performs by comparing historical, competition, and overall market results. And is a much better predictor of the company’s future success overall.
The Return on Equity Vs. Cost of Equity
Comparing returns on equity to the company’s cost of equity conveys that companies create value for investors.
A company earning returns on equity higher than those costs of equity adds value. For example, if we look at the cost of equity for Microsoft, which runs around 7%, it remains far below the current return on equity.
The comparison indicates Microsoft’s leadership creates value with its investments because the return on equity far exceeds its cost.
The general rule states that companies with an ROE higher than the cost of equity create value, while companies with an ROE less than the cost of equity destroy value.
In addition, the wider the spread between ROE and cost of equity, the higher the price valuation compared to book value. Book value is another term for shareholders’ equity.
The cost of equity measures the risks of investing in stocks, which tend to outweigh other investments such as bonds or gold. As the theory goes, to compensate investors for that risk, we assign a higher cost or hurdle to overcome to reward us for the higher risk.
Over the last five years, the average stock market ROE was 13.84%, and the year-over-year performance resembled the following.
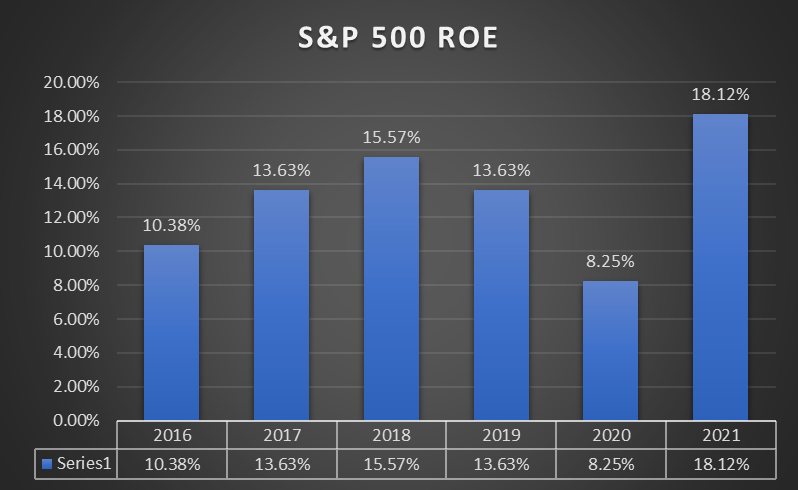
The average cost of equity for 2021 remained well below the average return on equity, indicating that the overall market exceeded its costs and generated excess returns.
However, the costs of equity will rise over time as the interest rates rise, leading to higher costs and riskier investments. Typically, when interest rates rise, valuations fall, making companies with less predictable cash flows a riskier investment.
When you find a company generating good returns on equity relative to their sector, history, and markets, it is good to ensure the returns exceed the costs.
Drawbacks To Using Return on Equity Formula
The return on equity also has drawbacks; for example, share buybacks and leverage can impact a company’s returns on equity.
Let’s explore the leverage or use of debt first.
A company with a high ROE might successfully generate high returns internally from operations. But it doesn’t always indicate the risks associated with the profitability. For example, a company might employ high debt to generate higher net income, increasing the ROE.
For example, if Visa has $150,000 in equity and $850,000 in debt, Visa’s total deployed capital equals $1 million. That number equals the same number of total assets employed because the balance sheet needs to balance.
At 5%, it will cost Visa $42,000 to service that debt with interest payments annually.
If Visa manages to increase its profits before any interest payments to 12% returns on capital employed, then Visa’s remaining profit after paying its interest equals $78,000.
The increased profitability of $78,000 would increase or magnify the return on equity.
The profit increase would double the ROE from 5% to 10%, assuming the profits get reinvested.
The increased leverage is not represented in the return on equity formula, so it is important to remain mindful of each company’s debt levels.
The other drawback is that share buybacks can skew results as well.
When management uses cash or debt to buy back shares from the market, they reduce the number of outstanding shares, increasing ROE as the denominator shrinks.
Typically, companies carrying higher intangible assets such as goodwill, copywrites, patents, and others on their balance sheets offer higher returns on equity, which showcases the importance of comparing apples to apples.
For example, Walmart’s balance sheet doesn’t resemble PayPal in the slightest, and comparing those companies’ ROEs would not be fair.
Investor Takeaway
Some industries, such as tech, achieve higher returns on equity than others, and therefore, ROE remains most useful when companies within the same sector or industry.
Using return on equity to find profitable companies is a great metric to help investors find those companies.
Even though the ratio is a simple calculation, it conveys much information investors can use to find great businesses.
Remember Warren Buffett’s words: finding companies that consistently reinvest their earnings over a long period tends to generate investor returns far surpassing those in the markets.
And with that, we will wrap up our return on equity formula.
Thank you for reading today’s post, and I hope you find some value. If you have any questions or I can further assist, please don’t hesitate to reach out.
Until next time, take care and be safe out there,
Dave

Dave Ahern
Dave, a self-taught investor, empowers investors to start investing by demystifying the stock market.
