In one of the recent Investing for Beginners Podcast episodes (Episode 117), Andrew and Dave breakdown some extremely useful Stock Analysis Tools that they have used and would recommend that you use when evaluating stocks as well.

One tool is something that I use quite frequently, on a weekly basis or more, while the other is a brand-new tool for me.
Here’s a summary of what was discussed in the episode, along with an embedded player so you can listen right here if you prefer. Enjoy!
Stock Analysis Tool #1: Seeking Alpha
I personally use Seeking Alpha quite frequently. In general, I think the best part of seeking Alpha is how easy they make it to compare a stock to another and to look at similar stocks. In the screenshot below, you can see that I typed in the ticker ‘PG’ to see The Procter & Gamble Company:
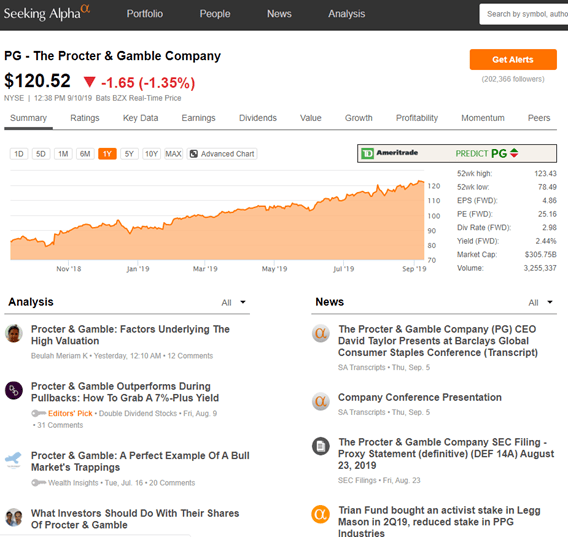
As you can see, it has a lot of data that a typical finance website include, but one of the most useful tabs is on the very end, called ‘Peers’.
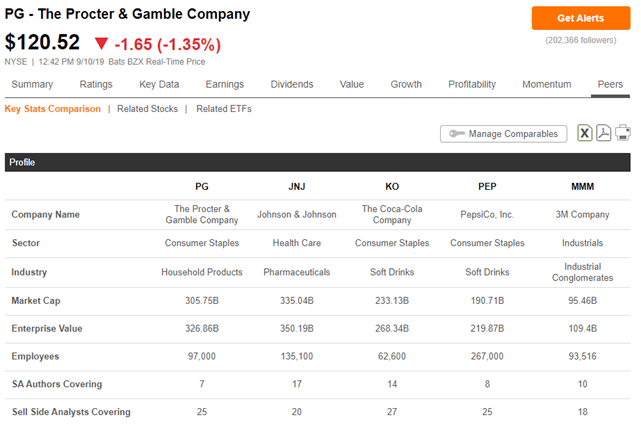
When you click on this tab, it shows exactly what you might think – peers of the company. But, a lot of people might think that ‘Peers’ would be direct competition, but that’s not what Seeking Alpha does.
They will base their peers off of many different things, such as sector, industry, market cap, enterprise value and even the number of analysts that are covering the stock.
They’re truly trying to find the most similar comparison to the stock that you are evaluating so you can evaluate companies on an apples to apples basis!
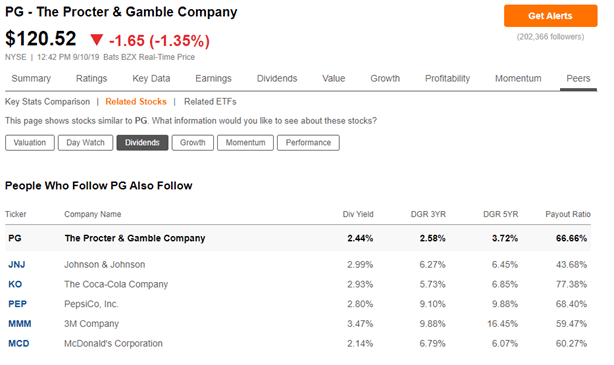
Overall, I think my favorite part is that you can compare even more specifics of those peers if you click on the ‘Related Stocks’ tab.
Once you do that, you can compare the peer’s valuations, day watch, dividends, growth, momentum and performance.
Below, I show a screenshot of the dividend screen for PG:
Stock Analysis Tool #2: QuickFS.Net
QuickFS.Net is a tool that I was completely unaware of until Andrew mentioned it on his podcast and I am ever grateful that he did this.
QuickFS, which I am assuming stands for Quick Financial Statements (although this is 100% an assumption lol) is an extremely helpful tool and has a free and a paid subscription model for you to choose from.
The free version still provides a great amount of information to help you find the information that you’re looking for.
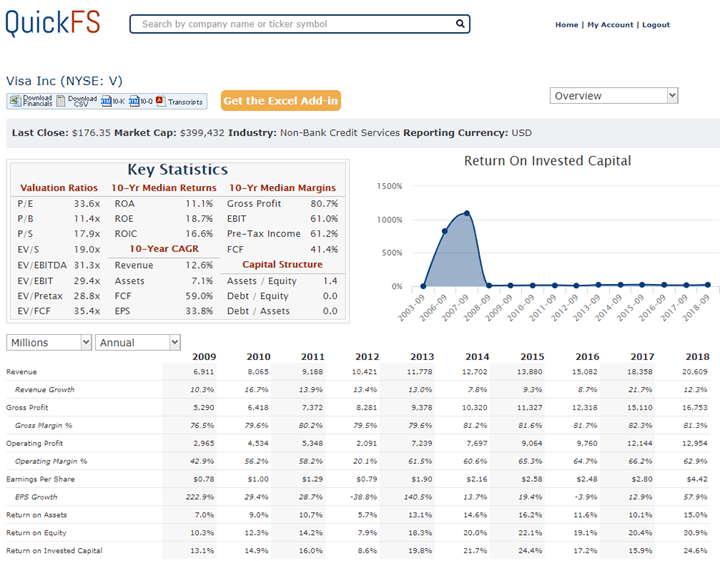
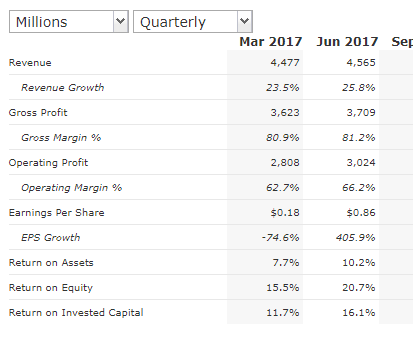
For instance, take a look at the screenshot below for Visa:
I mean, really, isn’t this freaking awesome?
While I do think that reading through 10Ks is an extremely useful process that you should continue to do, especially when looking at a new company, this really can help cut down on some time when you’re gathering the quantitative information to evaluate.
As you can see, they give you a lot of very important factors that people look at, such as the key valuation ratios, 10-year median returns, margins, CAGR, and many other numbers that people tend to really focus on such as Revenue, Profits, EPS, etc.
You also have the ability to switch the view from annually to quarterly by selecting the dropdown, but it’s important to note that you are limited to 10 quarters on the free version.
In addition to seeing the overview of the stock that you have chosen, you can dropdown on that part for more options which will allow you to select Income Statement, Balance Sheet, Cash Flow Statement or Key Ratios.
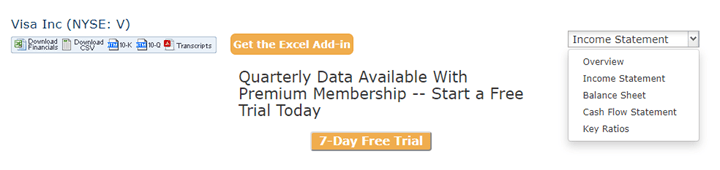
Personally, I think that my favorite tab is the Key Ratios selection because those are a lot of the numbers that I focus on.
But the beauty of this tool is that there’s so much data for you to look at and it’s all summarized right in front of your eyes.
So, while in the past you may have only evaluated a few different ratios or metrics because of the time that it took for you to compile and summarize the data, QuickFS.Net has done that for you here – for free!
I would be remiss not to mention that there is a version that you can pay for that is $348 annually ($29/month) if you lock in for a year or it is $35/month.
Honestly, I don’t think that the average investor would generate enough value to make it worth the cost. For instance, Andrew often talks about putting in $150/month…if you did that and paid the $348 for QuickFS.Net, that is almost a 20% hit right off the bat – so your returns better beat your alternative by that much if you want to break-even! But of course, I digress.
Below shows the added benefits that you get with the subscription version:
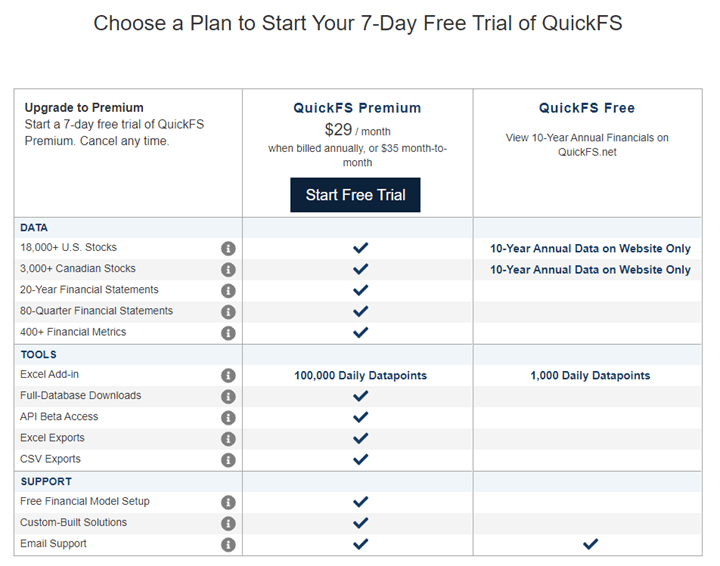
I purposefully included the cutout at the top that shows you can get a free 7-day trial if you’re entertaining the subscription model.
If you want to try it out you can do so – no harm, no foul. I do think that significant value can be obtained by the subscription model – it just depends how much time you spend looking at this type of data now and how much of a benefit you think you can receive.
Personally, I think you would benefit greatly from subscribing to Andrew’s eLetter or his Value Trap Indicator which both are more applicable to investing and I think more “all-in” type tools for the beginning investor.
Andrew has spent a ton of time perfecting his craft and he has really narrowed down the information in a way to help the beginning investor be able to decipher the necessary information to make well-informed decisions.
Don’t take my word for it though, check it out!
If you’ve read through this tool and haven’t found anything useful or anything that can help save you time….then I call BS!
All kidding aside, it was fun for me to go through the podcast episode and listen to what they had to say and to reflect on it.
No matter if a tool is brand new or if you use it on the reg, I guarantee that you can learn something new about it.
Take a look at both these tools and comment about something new that you found that I didn’t mention – after all, we are all here to learn!
