Recently I read an article in one of my favorite unbiased news publications, the Wall Street Journal, and they talked about triple leveraged ETF and why it was a horrible investment. Until that time, I had never even heard of these 3x ETFs so it made me curious to learn more about them!
First off, what are 3x ETFs? 3x ETFs are meant to basically triple the returns that you might expect of a particular ETF.
So, let’s take the Nasdaq for instance. You can invest in an ETF that is meant to mimic the returns of the Nasdaq like QQQ or you can invest in TQQQ which is meant to triple the returns of the Nasdaq.
Now, triple is triple, so you’re getting triple the returns and triple the losses as well. Initially, I have two thoughts that come to mind:
- wow, this seems terrifying to have triple the risk
- wow, this seems amazing to have triple the opportunity
See how those two can be directly contradictory of one another? You’re going to love the up days and you’re going to hate the down days.

In the past I have talked about how I am a huge risk taker and love to get risky with my money. That doesn’t mean that I just want to gamble it away, but I am willing to strike out for better odds of hitting a homerun, but that’s solely because I am 30 and hopefully will have 50+ years remaining in my life.
Right now, a huge win can set me up for success more so than a huge loss would set me back, but I make sure that every risk that I take is extremely calculated and not something that I am just doing on a whim.
At first my mind thought, “well, the stock market historically has always gone up, right? So, why would I not want to just sit there and take three times the gains as long as I can hold the stock for the long-term?”
Well, there are a couple of reasons:
1 – The Compounding Effect
This is something that has caused a lot of thought to go on in my little brain lol. We all know that not all gains and losses are created equally, right?
Imagine this:
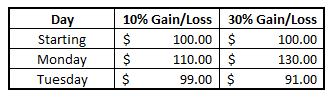
You buy a $100 stock. It gains 10% on Monday and is now worth $110. If it loses 10% the next day then it’s now worth that same $100, right? Up 10% one day, down 10% the next – you’re back at the same spot, right? Nope.
Since the stock is $110, when you lost 10% on Tuesday, you lost $11, meaning you now have a $99 stock.
This is something that’s even more prevalent when you’re investing in an ETF that is meant to get you 3x the performance of that index.
Using this same example, you would’ve made 30% on Monday all the way up to $130! Then, on Tuesday, you lost 30% and are down to $91. Your gains are larger but your losses are wayyyy worse.
The thing that really made it hard for me to wrap my brain around was the fact that this compounding is nothing more than an arbitrary benchmark, right? Who says that we have to “reset” the gains/losses at the end of the day? That’s ludicrous, right?
Well, it might be, but that’s what many of these 3x ETFs do. Many of these ETFs will reset their leverage daily so they can start out at the perfect leveraged ratio the next day. If they don’t do that, things would get out of whack and you might be buying into a imperfectly leveraged ETF thinking it was 3x.
In summary, they’re basically locking in their losses and their gains each day, so using a daily performance as a pricing indicator is actually a legit process, therefore meaning you need to out perform losses by more than you would in a normal ETF. Their goal is to mimic the DAILY returns of these indexes rather than the monthly, annual, etc.
AKA – Danger Danger.
2 – Fees
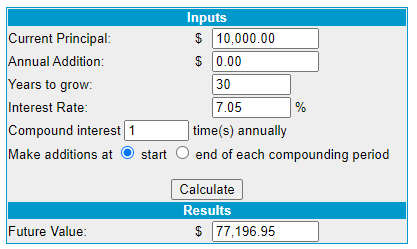
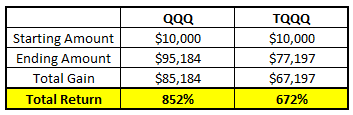
The fees are much higher in a 3x ETF than they are in a normal ETF. For instance, the expense ratio for QQQ is .20% while TQQQ is .95%. I know that .75% might not seem like a ton, but if you invested $10K into QQQ for 30 years and got an 8% return, then taking out the .2% expense ratio, you’d have $95,183.75:

If you did the same thing with TQQQ and took out the .95% expense ratio, you’d only have $77,196.95 in 30 years:
Pretty significant difference, right? In total, that extra .75% expense fee would’ve taken your total return down from 852% all the way to 672%:
Don’t get me wrong – that’s still a really nice situation to be in 30 years down the road, but that’s absolutely something that you need to consider when you’re looking at ETFs.
At this point, what’s your gut feeling? Feeling a little sick to your stomach? Excited? Both? Honestly, I think I’m in the “both” camp. I still want to better understand the data a little bit to really get a feel of how these ETFs have performed over the long-term so guess what, that’s exactly what I am going to do!
I found this awesome list of a lot of leveraged ETFs on Stock Market MBA and you can even download the entire list if you want. I downloaded the entire list and there were 205 different ETFs that ranged anywhere from being 4x to -3x – quite the range!
To keep myself from getting too far down a rabbit hole with all of the different ETFs that I could analyze, I wanted to focus on some of the highest volume ETFs that there are. For comparison purposes, I also decided to focus on ETFs that tried to 3x a certain index such as the Nasdaq or the S&P 500.
When I did this, I ended up with three different ETFs, all at a 3x leverage, that are meant to mimic the Nasdaq, the S&P 500, or the Dow 30:

Click to zoomWhen I went to Yahoo Finance, which is my favorite place to download historical data, I found that most of these 3x ETFs all were about 10 years old or so. To make things easier to compare, I chose to start all of the comparisons on 2/1/2010 since that was the youngest range of the 3x ETFs, so essentially, I have 10.5 years of historical data.
Are you excited to see the results? I know that I am!
Since I have already been talking a little bit about TQQQ and its performance vs. QQQ (the Nasdaq), let’s go ahead and get started with that comparison.
If you had invested $1,000 into the Nasdaq via the QQQ ETF on 2/1/10, you would now have $7,186.54! That’s not too shabby at all. In fact, those returns are actually insane. But what if you had invested $1,000 into TQQQ instead?
Your returns would be much, much greater…as in you would have $76,612.99!
Legit 10x what you would have if you invested in QQQ. Now of course, there are going to be some fees built into that, but those fees are so stinkin’ minimal when you’re talking about that type of outperformance:
Below is a breakdown of the two ETFs on an annual basis:

Note that 2020 is thru October as I am writing this mid-November.
When I first saw these massive returns, I honestly thought that maybe it was because the ETF was having some major outperformance in the early years and it skewed the data.
Nope.
That was wrong.
The first 6 years averaged 22% outperformance while the last 5 averaged 43% annual outperformance. The thing is that as long as you held this ETF over the long-term, you would be in some really, really great shape.
Sure, there are a lot of bumps and bruises along the way in 2015 and 2018 when you’re down 16% vs. QQQ, but you’re still going to be just fine as long as you’re focused on being a long-term investor.
Not gonna lie – the returns were so insane that I actually questioned if I was doing my math right. I went to ETF.com to double check myself and it turns out that I was in fact correct. Below is a 5-year graph but the 10-year averages are also included in the chart at the bottom:

So, all things considered, I honestly think that TQQQ really does seem like a pretty solid investment as long as you can wait out those super tough years (and maybe try to take advantage and add to your investment then!)
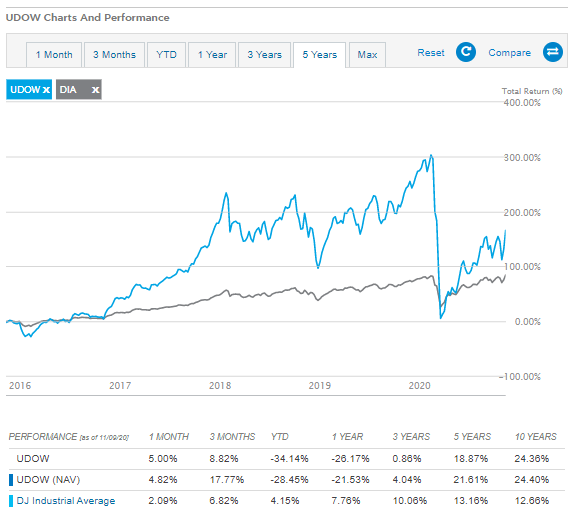
Ok, onto the next one! Let’s take a look at DIA, an ETF for the Dow, and compare it to UDOW, the 3x ETF for the Dow:
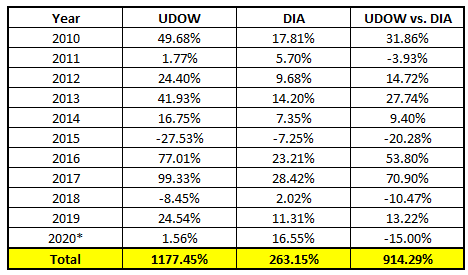
Your $1,000 investment in DIA would’ve turned into $3,631.52, a pretty solid return! But investing that same $1,000 into UDOW would’ve resulted in you getting returns of $12,774.45!
Yeah, I think I’ll gladly take returns that made me nearly 4x!
Similar to TQQQ, there are definitely some tough years such as 2015 when you’re down 27.53%! And 2018 would’ve been particularly tough as well when you’re down a hefty amount of 8.45% and the DIA is actually up 2.02%. 10.47% isn’t some life ruining amount to underperform for one year, but the fact thay UDOW was down so much and the DIA was up can really challenge the rationale of even the most stable investor.
That difference between losing money and making money, albeit can by .01%, is a huge thing for the psyche of an investor. That’s why it’s really important to know yourself before you even start considering investing in an ETF like this because you are going to be in for a super wild ride.
Something that I didn’t show in this chart is that there are some INSANE monthly changes. I mean, take a look at what happened just from 1/1/20 – 3/1/20:
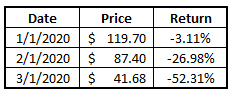
If you bought one share of TQQQ at $119.70, you’d now have $41.68! Your investment eventually was cut by 2/3. Ouch…
What do you do now? Do you sell? Add more? Nothing? Now is the turning point. Do you trust yout investments enough to buy more or freak out and panic buy?
If you had sold, you’d lock in those losses. If you had held, your $119.70 is now worth $88.76, not quite to where you started but up more than double from where you were considering selling. And guess what, I won’t be shocked if it’s up even more in the future, but that’s purely speculation by me looking at those trends!
Looking at ETF.com again, I can see more of the following proof for what I just described above:
Long story, short – not a bad investment as long as, again, you’re focused on being long-term!
And now we’re off to the final comparison – UPRO vs. SPY. The reason that I am so excited for this comparison more than the others is because I view SPY as my benchmark when I am investing.
Just as you’ll hear people refer to the T-Bill rate as the “risk-free rate” because anyone can get that, I view SPY as my own personal “risk-free rate” because I’m at the point in my life where I am investing ONLY in stocks, so SPY would be what I could return simply by doing nothing.
So, for that reason, I am super curious to see if this 3x ETF outperformed SPY just like the other two 3x ETFs did – let’s take a look!
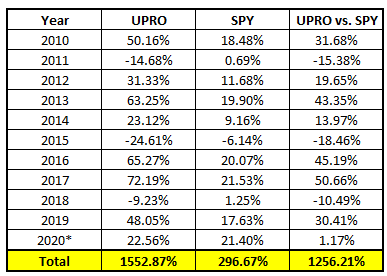
YUP! Sure freaking did!
$1,000 on 2/1/10 in SPY would’ve been $3,966.66 now while UPRO would’ve been worth $16,258.73, over a 4x outperformance!
Again, just absolutely massive returns and ones that are super exciting to see. Again, major bumps along the way, similar to the others, but the long-term is going to play out in your favor!

So, these returns are pretty dang nice, right? You ready to put your life savings into them? In the words of Lee Corso, “Not so fast, my friend!”
Yes, you can get some monstrous gains by investing in these ETFs, but you need to have some serious dedication and trust that these ETFs really are going to rebound when you have these massive dips occur. Personally, I’m not sure if it’s something that my stomach could handle, and that’s completely ok!
I’d rather miss out on these returns than I would invest in them and sell at a low point – that sounds like the opposite of the goal to buy low and sell high, right?
I’m not going to completely write off these ETFs, but I am going to put these on the backburner. I’m going to continue to do my due diligence and try to read and understand them better so I can make a more-educated decision.
And in addition to that, I’m going to keep growing my risk appetite so maybe one day I can dabble a little bit and see how things turn out!
