Cash conversion is a key concept in investing.
It helps investors determine how effective they are at translating earnings into cash. It also helps us better understand the liquidity of the business.
Terry Smith of Fundsmith uses it to help him identify quality companies.
In today’s article, we will learn:
- What is the Cash Conversion Ratio?
- How Do We Calculate the Cash Conversion Ratio?
- What is the Significance of the Cash Conversion Ratio?
- Case Studies: Real-World Examples
- Limitations of the Cash Conversion Ratio
Okay, let’s dive in and learn more about the cash conversion ratio.
What is the Cash Conversion Ratio?
The Cash Conversion Ratio (CCR) serves as a critical financial metric that provides insights into a company’s ability to manage its cash flow efficiently.
At its core, the CCR quantifies the efficiency with which a company converts its net income into free cash flow, offering a window into its operational effectiveness and financial health.
Defined as the ratio of free cash flow to net income, the CCR plays a pivotal role in assessing the effectiveness of a company’s cash conversion process.
Free cash flow represents the funds generated from core business operations, while net income reflects the company’s profitability after all expenses.
We define free cash flow as operating cash flow minus capital expenditures. We can find both items on the cash flow statement. This version of free cash flow helps investors understand the cash needed to operate the business and investments to continue growing.
By comparing these two figures, the CCR evaluates how effectively a company translates its earnings into actual cash available for reinvestment, debt reduction, or other financial activities.
A high CCR indicates that a company is adept at efficiently converting its net income into operating cash flow, which can be a favorable sign of strong working capital management and effective cash flow generation.
On the other hand, a low CCR may suggest potential inefficiencies or challenges in the company’s cash conversion process, warranting further investigation into its operations and financial practices.
The Cash Conversion Ratio offers investors, analysts, and stakeholders a valuable tool for assessing a company’s cash management prowess.
It goes beyond just profitability figures to provide a comprehensive understanding of how effectively a company translates its earnings into tangible cash, allowing for more informed decision-making regarding investments, financing, and strategic planning.
How Do We Calculate the Cash Conversion Ratio?
Efficiently evaluating a company’s prowess in translating net income into cash flow necessitates a comprehensive grasp of the Cash Conversion Ratio (CCR) calculation.
This short guide provides a roadmap to navigate this critical financial metric, shedding light on its nuanced intricacies.
The formula is a one-step simple calculation that helps us determine whether Texas Instruments is in good shape or on the struggle bus.
Its fundamental constituents are central to the CCR calculation:
- Net income
- Operating cash flow
- Capital expenditures
Net income reflects the bottom-line profitability while operating cash flow unveils the cash generated from routine business activities. Simultaneously, capital expenditures depict investments directed toward operational assets for growth.
Another factor to take into account is the accounting cycle for each company. For example, companies with higher inventory levels, such as Walmart, might have higher cash flows at different points of the year. As inventory levels ebb and flow throughout the year, we will see the impact on Walmart’s cash flows.
A good resource to better understand the impact of inventories and accounts receivable is the cash conversion cycle.
We calculate the cash conversion ratio by using the following formula:
Cash Conversion Ratio = (Operating Cash Flow – Capex) / Net Income
The results give us a positive or negative value, which we can summarize as the following:
- A ratio above one equals a company with excellent liquidity.
- A ratio below one equals a company with weak cash conversion.
- A negative number means the company is losing money.
The ratio helps investors and management determine how well Visa turns sales and earnings into cash, and cash is the lifeblood of every company.
What is the Significance of the Cash Conversion Ratio?
The Cash Conversion Ratio (CCR) is a crucial financial metric that unlocks valuable insights into a company’s cash management prowess.

This metric is pivotal for understanding how effectively a company transforms net income into cash flow, shedding light on its liquidity, operational efficiency, and overall financial health.
A high CCR heralds efficient cash management. When a company boasts a high CCR, it indicates a good ability to convert its net income into available cash. It also demonstrates a well-oiled machine related to working capital management, efficient collection of receivables, and streamlined payment processes.
Such a scenario signifies a company equipped to meet its financial obligations, fund growth initiatives, and navigate unforeseen challenges without straining its resources.
Conversely, a low CCR might raise flags concerning liquidity and operational efficiency. A low CCR suggests the company might face hurdles in converting its net income into cash flow and could indicate sluggish payment collections, excessive inventory holding, or inadequate working capital management.
A low CCR may reflect potential challenges in fulfilling financial commitments or impede the company’s agility in seizing growth opportunities.
When interpreting CCR results, analysts delve into the implications of varying values.
A high CCR often translates to robust operational health, portraying the company’s resilience in converting earnings into cash and potentially indicating effective management across many financial aspects. Conversely, a low CCR warrants scrutiny, as it can highlight areas where the company faces obstacles in translating profits into cash flow, potentially affecting its financial stability.
Understanding the contextual backdrop is pivotal when analyzing CCR outcomes.
Industry dynamics and business models are pivotal in influencing expected CCR values.
A moderately lower CCR might not be alarming in industries with lengthy payment cycles. On the other hand, sectors with efficient supply chains or subscription-based models might exhibit a high CCR due to the swift realization of cash flow.
The Cash Conversion Ratio unveils a company’s cash management strength.
Its implications go beyond simple profitability, diving into the intricate terrain of operational efficiency, liquidity, and overall financial agility. By scrutinizing CCR values and considering industry benchmarks, analysts and investors can discern a company’s capacity to navigate the complexities of the financial landscape, aiding in informed decision-making and strategic planning.
Case Studies: Real-World Examples
To best understand the cash conversion ratio, we need to implement it. Let’s use Apple as our first guinea pig. We can find all three inputs using the free cash flow statement and the company’s latest 10-K, dated 10/27/2022.
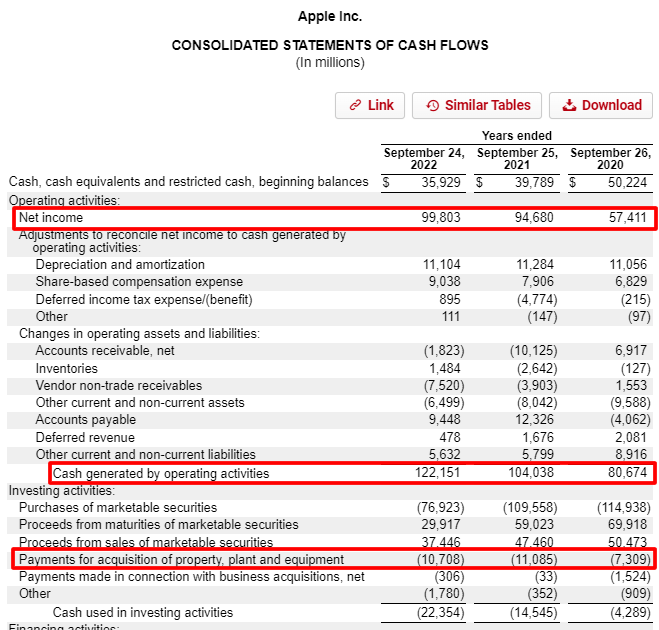
Pulling the necessary inputs from the above statement gives us:
- Net income = $99,803 million
- Cash from operations = $122,151 million
- Capital expenditures (Capex) = $10,708 million
Now, we can plug these numbers into the cash conversion ratio formula:
Apple CCR = ($122,151 – $10,708) / $99,803 = 1.12 x 100% = 112%
Pretty simple, huh?
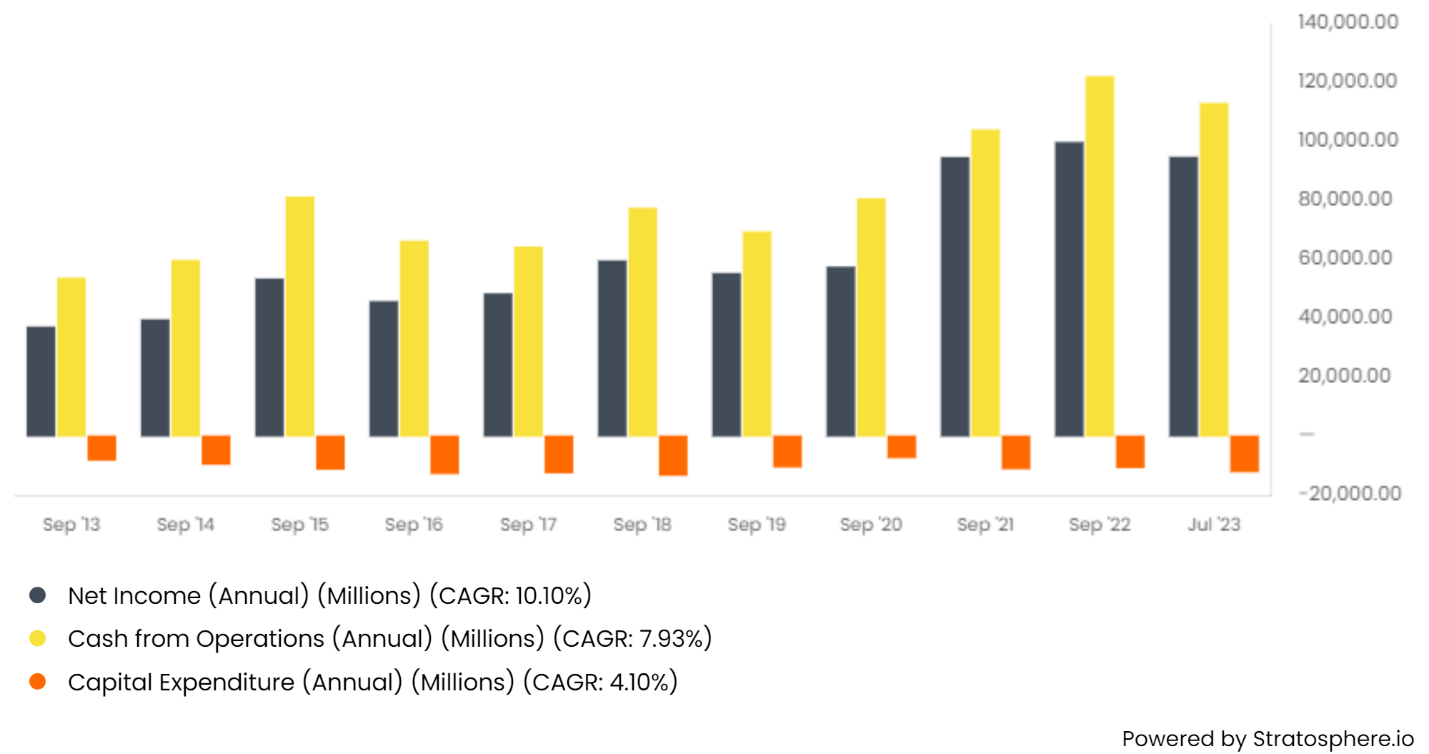
Let’s take this further and look at Apple’s cash conversion ratio over the past three years, including the information from the current finances.
CFO | Capex | Net Income | CCR | |
2022 | $122,151 | $10,708 | $99,803 | 112% |
2021 | $104,038 | $11,085 | $94,680 | 98% |
2020 | $80,674 | $7,309 | $57,411 | 127% |
Looking at the longer term, ten years, we can see:
- Cash from operations = $777,775 million
- Capex = $109,630 million
- Net income = $590,660 million
Apple’s 10-year CCR = ($777,775 – $109,630)/$590,660 = 113.1%
Or, we can see the year-by-year performance:
- 2013 = 120%
- 2014 = 126%
- 2015 = 131%
- 2016 = 114%
- 2017 = 105%
- 2018 = 108%
- 2019 = 107%
- 2020 = 128%
- 2021 = 98%
- 2022 = 112%
All this analysis can give us better insights into how well Apple converts its net income into free cash flow. Plus, we can see a year like 2021 is an anomaly and likely not something to concern us.
We can also adjust our definition for free cash flow if you wish. For example, we can adjust for acquisitions, which for Apple totaled $8,438 million over the same period.
The adjustment would alter the cash conversion slightly for Apple.
- Cash from operations = $777,775 million
- Capex = $109,630 million
- Acquisitions = $8,438 million
- Net income = $590,660 million
Apple’s CCR = ($777,775 – $109,630 – $8,438)/$590,660 = 111.6%
So, as we can see, there is a slight adjustment to the cash conversion ratio. However, Apple doesn’t use acquisitions much, and other companies such as Roper Technologies, Danaher, or Thermo Fisher, which utilize acquisitions, would see bigger adjustments.
Other adjustments you can make to free cash flow include items such as:
- Stock-based compensation
- Divestitures
- Write-offs
- One-time events
- Working capital changes
- Interest and taxes
The bottom line with adjustments is to remain consistent and apply them across the board. For example, if you adjust for stock-based compensation with Google, you must apply it to Microsoft and Amazon to compare apples-to-apples for cloud providers.
The best practices to follow for using the cash conversion ratio to its fullest are:
- Use company financials; we only need the free cash flow statement to find our required inputs.
- Calculate the ratio over the most recent year, three, five, and ten years to get a sense of consistency and history.
- If you alter your definition of free cash flow, remain consistent across companies.
Limitations of the Cash Conversion Ratio
While the Cash Conversion Ratio (CCR) is a valuable tool for assessing a company’s cash management efficiency, it must acknowledge its limitations and the potential pitfalls of relying solely on this metric for comprehensive financial analysis.

One must recognize the need to supplement CCR evaluations with other pertinent financial metrics to ensure a well-rounded assessment.
One of the primary limitations of the CCR lies in its focus solely on cash conversion from net income, operating cash flow, and capital expenditures. This narrow scope may not capture the entire picture of a company’s financial health.
For instance, CCR overlooks the timing of cash flows and fails to consider other crucial aspects, such as a company’s debt structure, investments in growth initiatives, or strategic acquisitions.
Moreover, an isolated reliance on CCR might lead to overlooking qualitative factors influencing a company’s financial performance.
Factors like management quality, industry dynamics, competitive positioning, and market trends can significantly impact a company’s cash flow dynamics. Neglecting these elements could result in incomplete analysis and flawed decision-making.
The significance of context cannot be understated. CCR values vary across industries and business models. While a low CCR might cause concern in some sectors, it might be the norm in others due to inherent industry characteristics. Therefore, interpreting CCR without considering industry benchmarks and comparative analysis could lead to misinterpretations and misjudgments.
Complementing CCR analysis with a broader range of financial metrics, such as the ones below, is imperative to mitigate these limitations.
These metrics can offer additional dimensions to assess a company’s financial standing and provide a holistic view of liquidity, leverage, and overall profitability, offering a more comprehensive evaluation of a company’s financial health.
The Cash Conversion Ratio provides valuable insights into cash management efficiency; it’s vital to recognize its limitations.
Solely relying on CCR for analysis might lead to oversights and incomplete understanding. For a comprehensive assessment, financial analysts must incorporate a range of relevant metrics that provide a more accurate portrayal of a company’s financial performance, stability, and growth potential.
Investor Takeaway
As we wrap up this blog post, let’s reflect on the Cash Conversion Ratio (CCR) through the lens of an investor.
This metric isn’t just numbers; it’s a window into a company’s financial efficiency and operational prowess.
The CCR offers investors a unique perspective on how swiftly a company can turn its investments into cash. It’s a gauge of management’s prowess in optimizing working capital, revealing the balance between growth and liquidity.
A high CCR might suggest effective inventory management and customer collections, signaling operational excellence.
But it’s not a one-size-fits-all scenario. A declining CCR could signify trouble, indicating possible inefficiencies in supply chains or credit policies. For an investor, the CCR is a treasure trove of insights, helping to assess a company’s financial health and risk factors.
Remember, the CCR is not a stand-alone tool but a part of creating a picture or story about Google related to its numbers.
It’s a tool to ask the right questions and dig deeper into a company’s cash cycle mechanics. So, armed with CCR insights, investors can navigate the market with a keener eye, making informed decisions and aligning their portfolios with companies poised for smart financial management and potential growth.
